



ISSUE #4, AUGUST 2026
HypeAuditor Digest
Fresh insights, trends, and updates

PRODUCT UPDATES
What's new inside HypeAuditor
We’ve updated how Engagement Rate is calculated in HypeAuditor to keep pace with how social platforms distribute content today. As the way people discover and interact with content changes, the metrics we use need to keep up too.
Here’s what changed, why we made the update, and what it means for the ER numbers you see in our reports.
The new ER formula
Across our influencer reports, HypeAuditor now selects the most relevant content type before calculating ER.
For accounts with enough Reels or video content, we use a view-based calculation:
ER = (Likes + Comments) / Views × 100%
When there isn’t enough video content, we use the post-based calculation:
ER = (Likes + Comments) / Followers × 100%.
In both cases, we calculate ER for individual pieces of content and use the median to give a more representative picture of recent performance.
MARKETING NEWS
What we're putting out there
Every month gives us a reason to make something new, useful, and worth sharing. And this month, we’ve got something a little different waiting for you. We think it’ll come in handy.
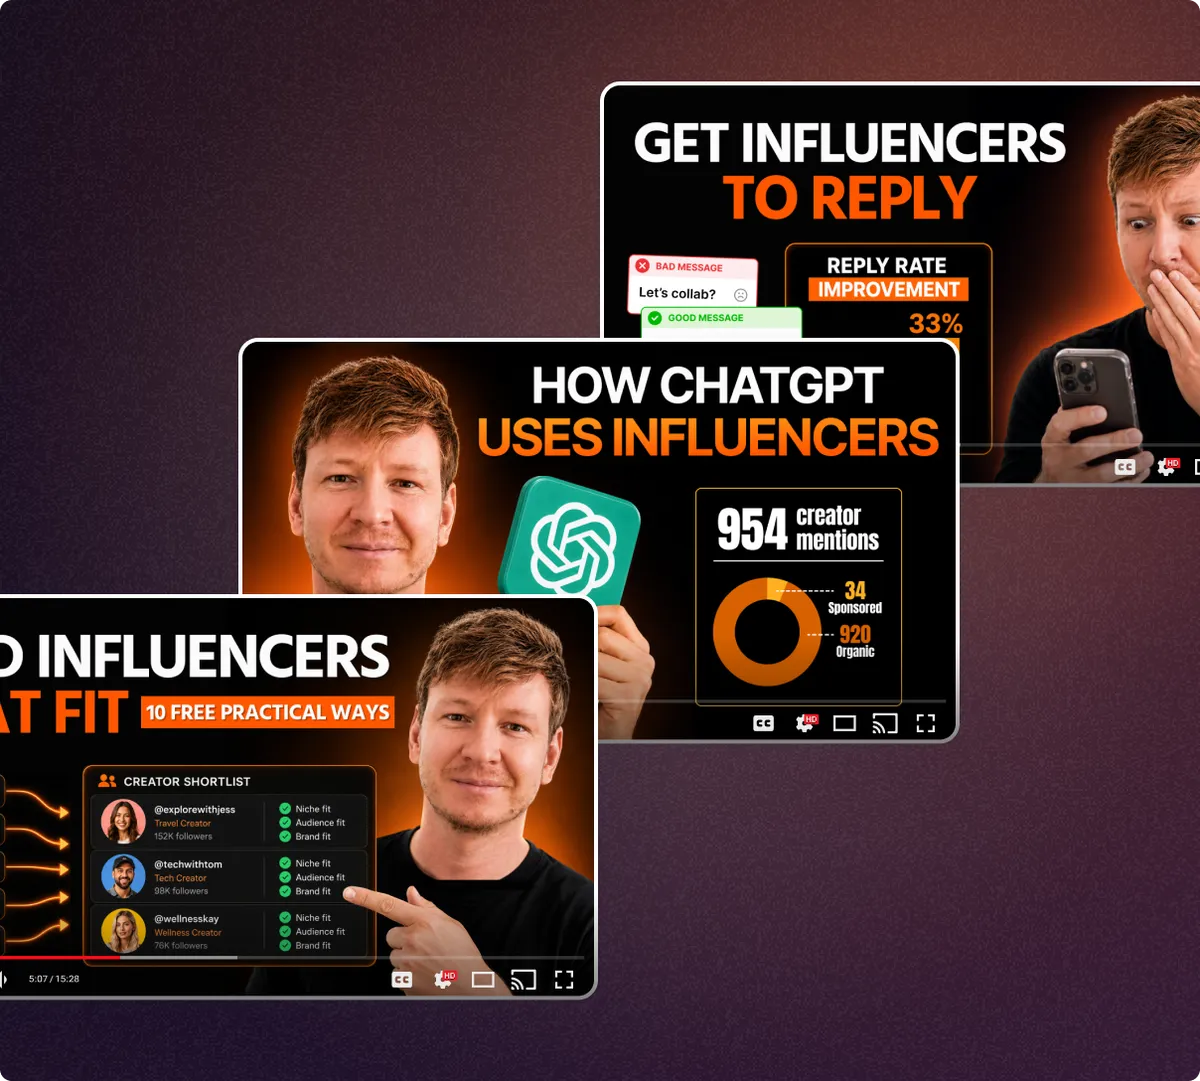
A fresh batch from the CEO’s YouTube
This month, Alex Frolov has been tackling a little bit of everything marketers run into in influencer campaigns: finding the right creators, getting them to reply, and figuring out what you can learn from another famous brand’s clever creator marketing moves. Pick your next play:
How to Find Influencers Fast (10 Practical Ways That Work) Influencer Outreach Strategy: How to Get 30%+ Reply RatesHow OpenAI Uses Creator Marketing (Strategy Breakdown) 📊A free course for anyone just starting out
If you're new to influencer marketing, or training someone who is, we just launched a completely free email course made for that. Seven lessons land in your inbox one day at a time, each one short enough to read on a break, narrated by a pirate cat with a decent sense of humor, so it never quite feels like homework. Could this be any better?
Sign up for the free course
SPOTLIGHT OF THE MONTH
The real reasons Engagement Rate matters in influencer marketing
5 reasons ER remains useful in influencer marketing

However, ER is one metric, not the whole verdict
There’s no universal “good” engagement rate, and no single number should decide a creator shortlist. Compare ER with relevant benchmarks, then look at views, audience quality, content fit, and your campaign goal for a more complete picture.
ANALYST’S CORNER
The right way to judge a creator's Engagement Rate
An ER number on its own does not tell you much unless you understand what it is based on and what a typical result looks like for comparable creators.
For this benchmark, I focus on view-based Engagement Rate
I find this approach specifically useful for Reels because follower count alone is becoming less informative about how much distribution a creator can actually generate. That is why I would always look at two metrics together: Median Average Views and Median Engagement Rate.

How to use the benchmark
The easiest way to use the benchmark is to take a creator you are considering and compare them with creators of a similar size in the same market. The table below breaks both metrics down by country and follower tier.
The easiest way to use the benchmark is to take a creator you are considering and compare them with creators of a similar size in the same market. The table below breaks both metrics down by country and follower tier.
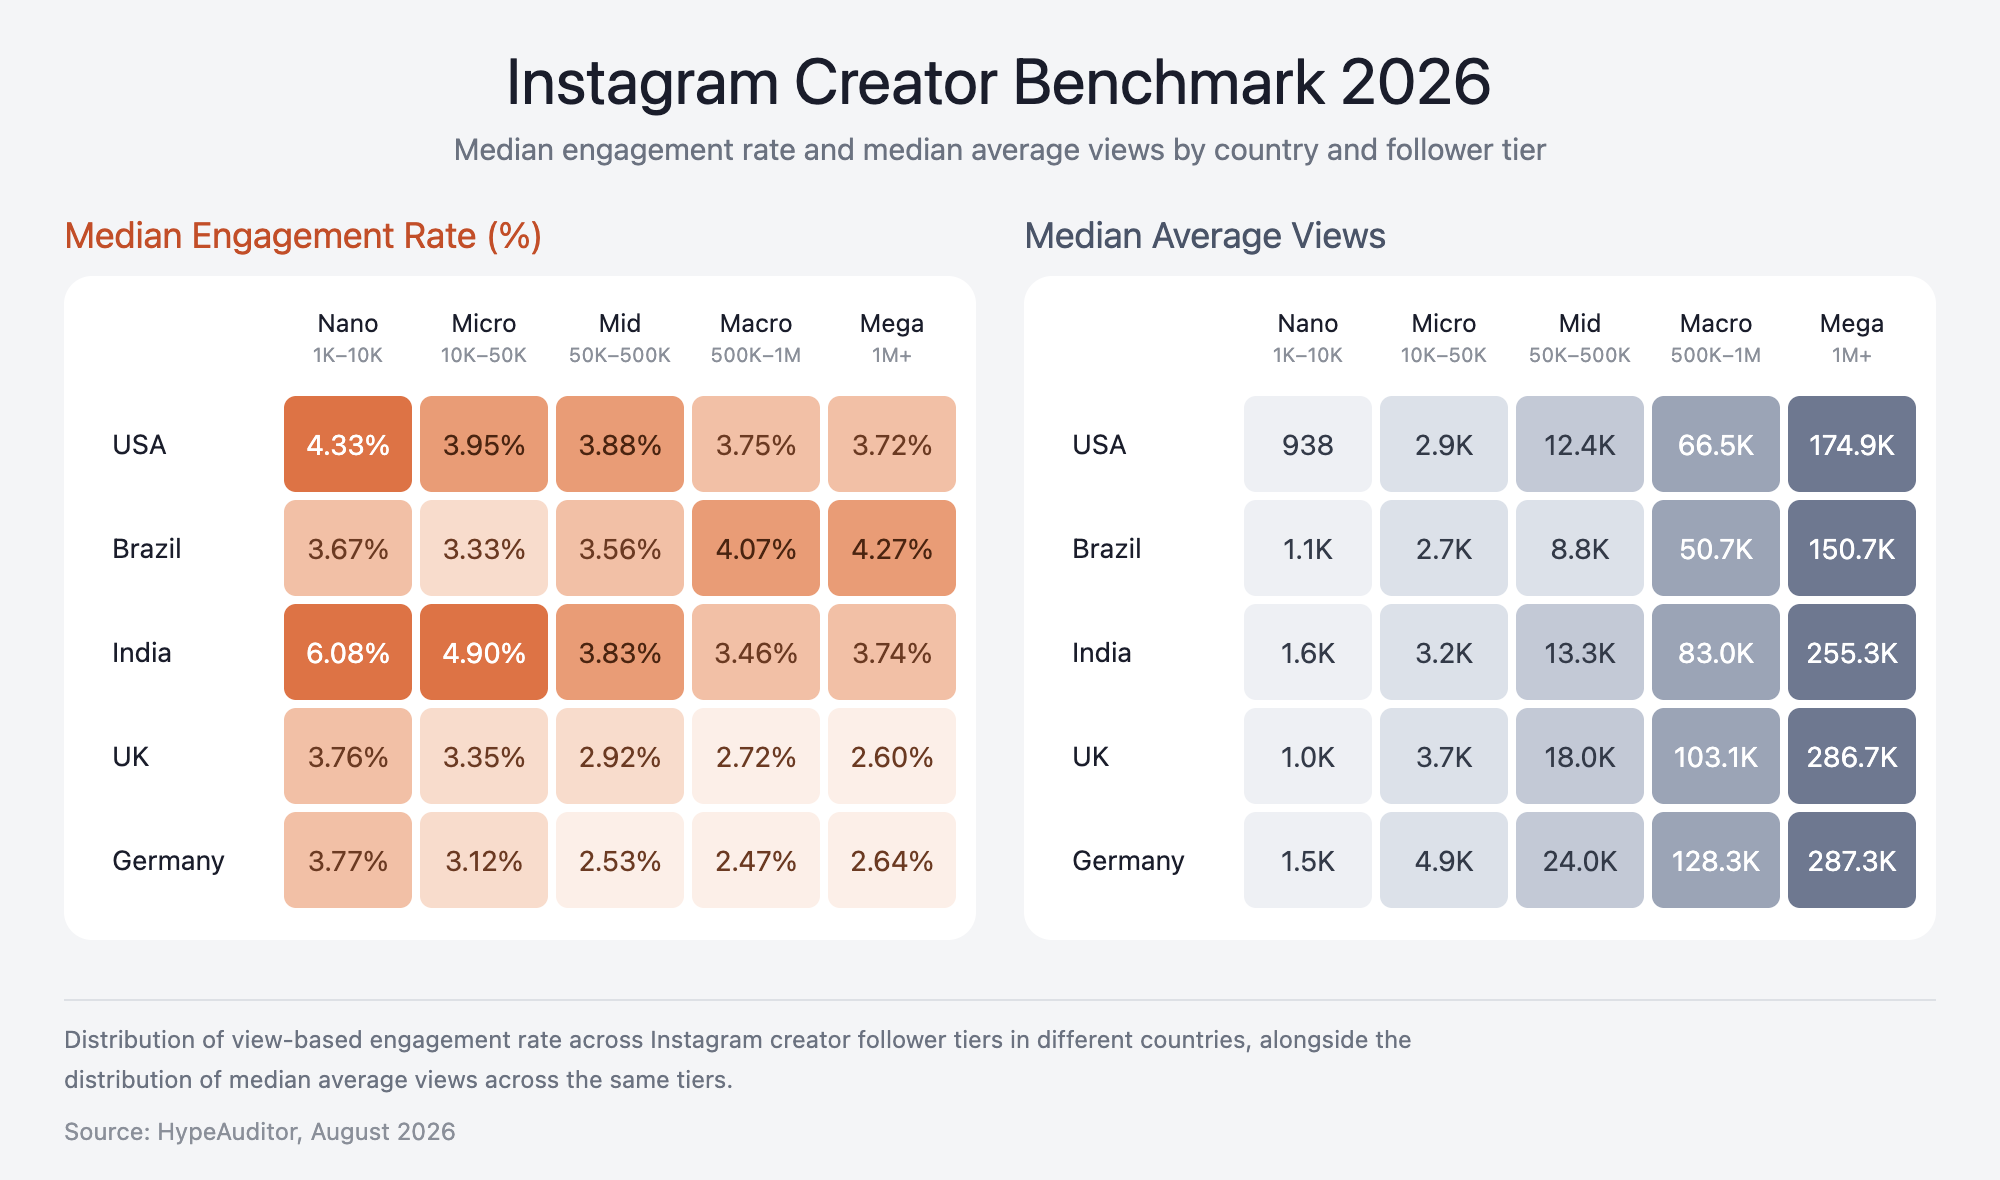
For example, among US creators with 50K–500K followers, our benchmark shows a 3.88% median Engagement Rate, with median Average Views of 12.4K.
These are medians, not targets or minimum requirements. A median simply means that roughly half of comparable creators are above that level and half are below it.
Now imagine you are considering a US creator with 150K followers who averages 30K views and has a view-based ER of 5%.
Both metrics are above the median for comparable creators.
That doesn't automatically mean you should sign them, but it's a useful indicator that their content is outperforming peers of a similar size in the same market, and a good reason to shortlist them for a closer look.
Views and ER tell you different things
I would not use either metric in isolation.
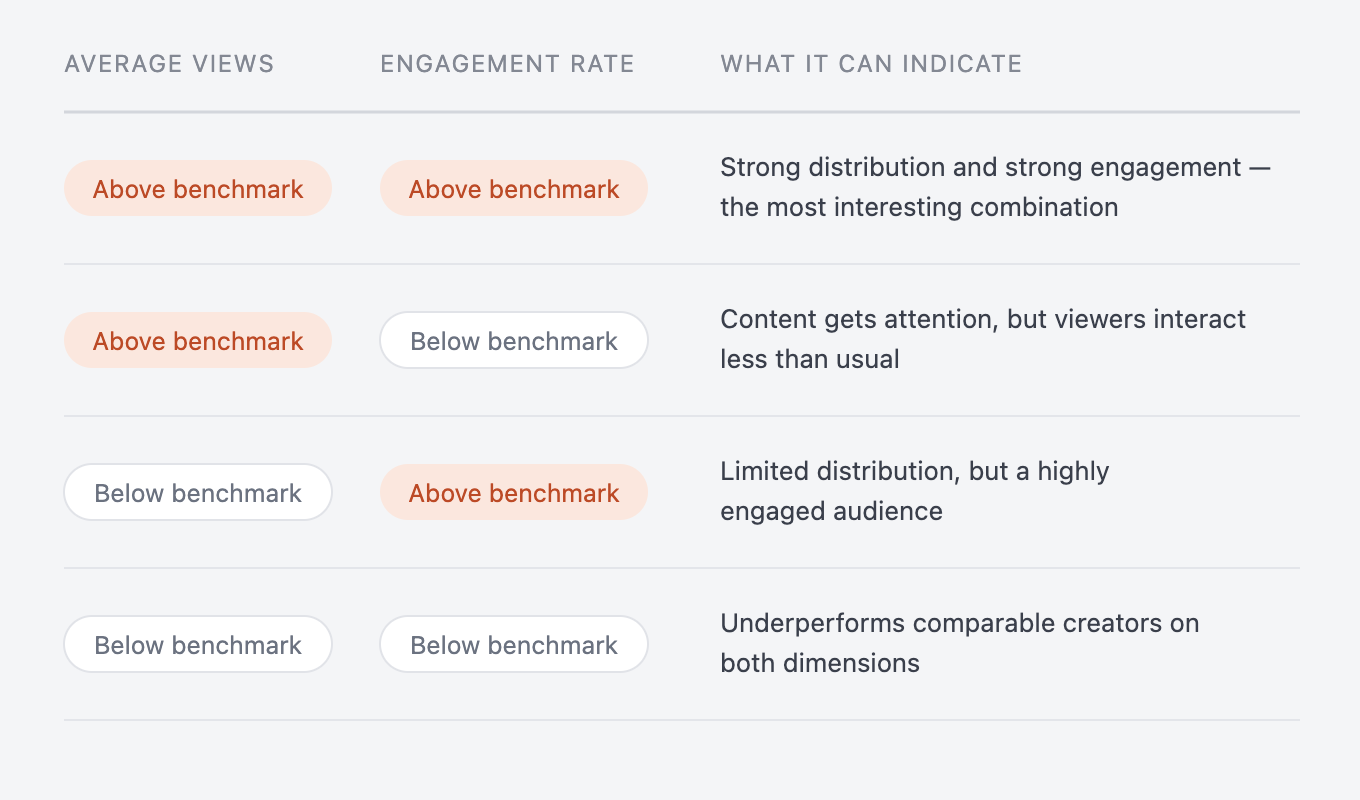
Average Views tells you about distribution power: how much attention the creator’s content typically manages to generate.
Engagement Rate tells you about engagement efficiency: how strongly people interact with the content once it reaches them.
Looking at both gives you a more useful read on where a creator stands:
There is another reason to keep both numbers in mind.
A 3% Engagement Rate on 1,000 views and a 3% Engagement Rate on 100,000 views represent very different levels of audience response.
The percentage may be identical, but the absolute scale of engagement is not.
Using organic Reels performance to select content for paid amplification
Brands increasingly take content that's already published organically and put paid media behind it, through Instagram Partnership Ads or similar tools. Organic performance can act as an initial creative signal here.
A Reel that significantly outperforms the typical views for comparable creators has already shown an ability to attract attention without paid distribution. I would start testing with content like this before spending the budget behind weaker performers.
I'd treat this as a creative pre-test, not a guarantee, since targeting, objective, and placement still decide paid results. Given a few assets to pick from, I'd start with whichever already showed it could attract attention on its own.
High engagement does not necessarily mean positive engagement
There is one more thing that benchmarks cannot tell us.
A high Engagement Rate tells you that people are reacting. It does not tell you why they are reacting.
A Reel may generate lots of comments because people love it. It may also generate lots of comments because it is controversial, confusing or attracting negative reactions.
So once the numbers flag an interesting creator or piece of content, the next step is qualitative: open the Reel, read the comments and understand what exactly is driving the engagement and whether that response is appropriate for your brand.
A benchmark gives you something to compare against
A 4% Engagement Rate can be strong for one creator and completely normal for another. It depends on factors such as follower size, market, and platform.
That’s why I would compare a creator’s views and ER with similar creators in the same market and follower range, rather than judging the number on its own.
Our benchmark is designed to supply that missing comparison, helping marketers identify creators and Reels that stand out from comparable content before moving on to the equally important questions of brand fit, audience quality, content quality, and campaign objectives.