Engagement rate (ER) is still the metric people reach for when they need a quick read on content performance. It is familiar, easy to explain, and fast enough to double-check a creator shortlist before moving forward. The issue is how often that number gets treated as if it means the same thing everywhere.
A like on Instagram is not the same action as a repost on X, a save on TikTok, or a comment on LinkedIn. Even when platforms use the same labels, the feed mechanics, content formats, and audience habits are different enough that two creators with the same ER can be delivering totally different kinds of value.
Using platform-specific calculators is more practical than working out the formula yourself, since platforms count engagement in different ways and calculators already handle that. In this article, I've tested several ER calculators for different platforms that might help you know what to expect from each one.
This is the table summary of the engagement rate calculators I’ve tried:
| Platform | Social media covered | Input Type | ER Calculation Basis | Free/Paid |
|---|---|---|---|---|
| HypeAuditor | Instagram, YouTube, TikTok | Username | Median value of 12 most recent posts | Free |
| Socialinsider | Instagram, YouTube, TikTok, Facebook | Full profile URL | Not stated | Free |
| Postplanify | LinkedIn calculator | Numbers/Manual | - | Free |
| Hootsuite | Numbers/Manual | - | Free | |
| Phlanx | TikTok, YouTube, Twitter, Twitch, Kick | Username | Not stated | Free |
| SocialCat | Instagram, TikTok | Username | Median number of likes & comments per post | Free |
| TrendHERO | Username | 18 last posts | Free | |
1. HypeAuditor
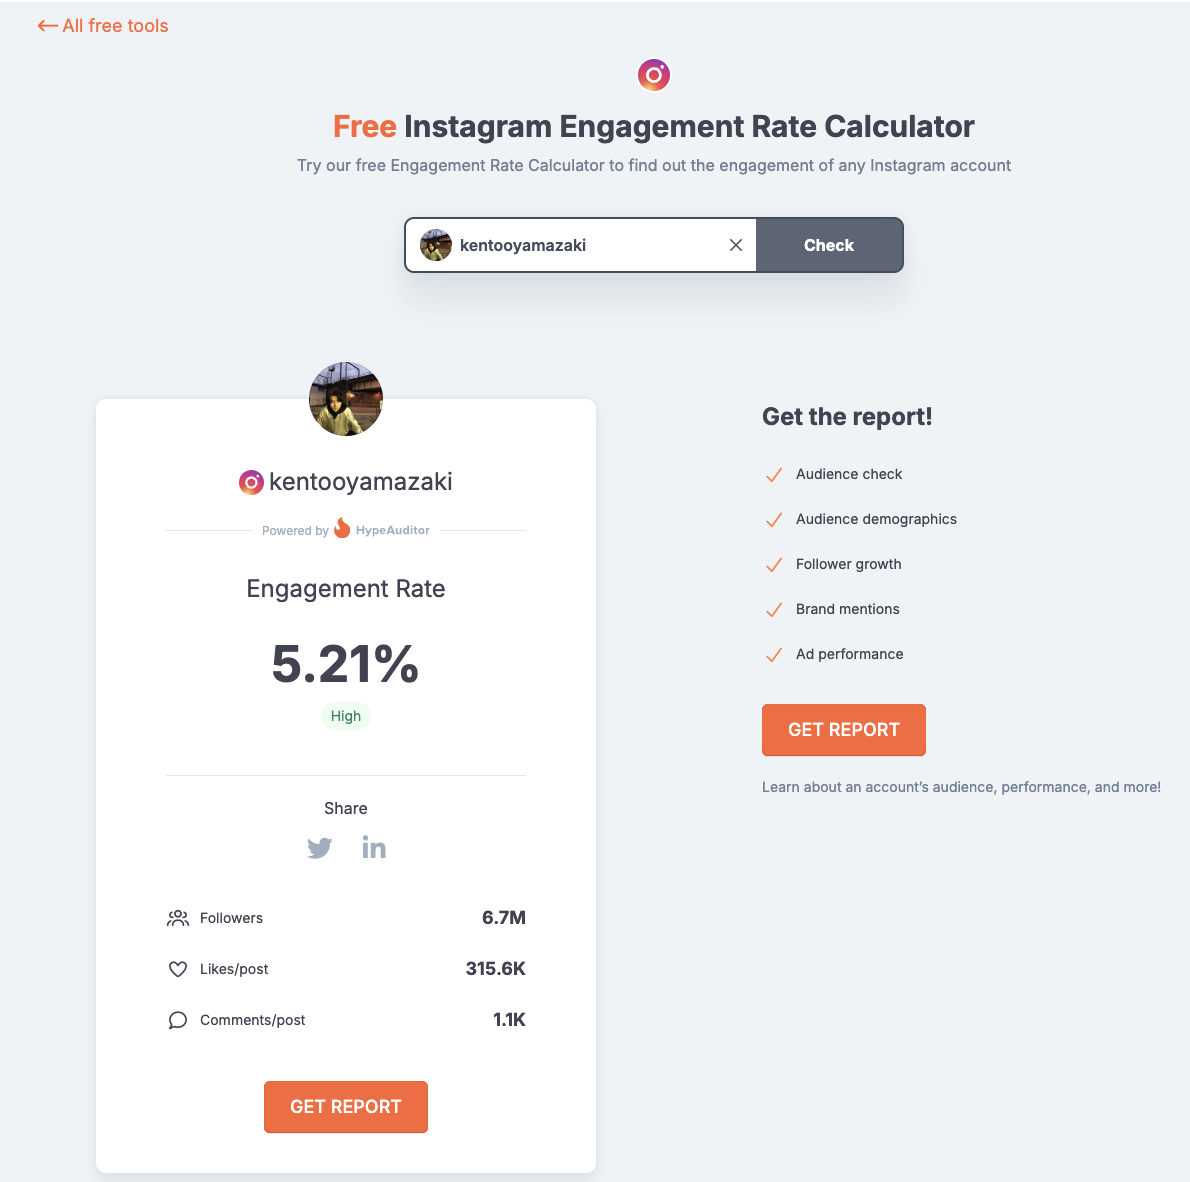 HypeAuditor provides a set of free tools designed to support different stages of influencer research. The engagement rate calculator is one of them, and it works across Instagram, TikTok, and YouTube. You enter a creator’s username, and the tool instantly returns key metrics such as engagement rate, follower or subscriber count, average likes per post, and average comments per post.
HypeAuditor calculates engagement rate using the 12 most recent posts. The result is based on the median engagement rate, with unusually high or low posts excluded to avoid skewed results and provide a fairer view of performance.
By clicking “Get Report,” you can access a more comprehensive influencer report that goes deeper than basic engagement metrics, such as: influencer ranking, follower growth rate, historical data on account growth, and estimated income. However, some sections of the report are gated, and you’ll need to register for a free account to unlock them.
Use cases
Instant engagement check before shortlisting creators
Validating performance claims during outreach
Early-stage influencer research without a paid subscription
Who it’s best for
Brands screening potential partners
Agencies handling multiple creator evaluations
Creators who want a simple overview of their public metrics
Key features
Works for major social media platforms: Instagram, TikTok, and YouTube
Instant display of ER, follower count, average likes, and average comments
Access to extended influencer report without logging in
Pros
Easy to use
Fast loading result
Provide you a comprehensive free report that contains deeper metrics
My experience
Every test run went smoothly. The calculators showed exactly what I needed: engagement rate with an indicator of whether it’s good or not, plus additional metrics like follower or subscriber count and average likes and comments per post.
One simple thing I liked is the username suggestion list. When I input a handle, it shows matching usernames, similar to how we search on social media. This helps make sure I select the right account and avoids typos that could lead to invalid searches.
The output feels trustworthy and independent since it’s based on HypeAuditor’s own data, and I didn’t encounter any errors or inconsistencies during testing.
What makes this tool special, though, is the free report behind the “Get Report” button. Many calculators stop at showing engagement rate and a few averages. Here, I was able to access a thorough influencer report with deeper metrics, including rankings, growth data, and historical performance - although not for the full version. For a free tool, that level of access is rare and adds real value.
Test period
February 2026
Pricing
Free
| Tool name | HypeAuditor |
|---|---|
| Input needed | Username |
| Login needed | No |
| Output | Engagement Rate, Followers/subscribers Likes per post, Comment per post |
| Post sample | Last 12 posts |
| Export | Yes, account required |
| Usage limit | Yes |
| Update frequency/data last update | No |
2. SocialInsider
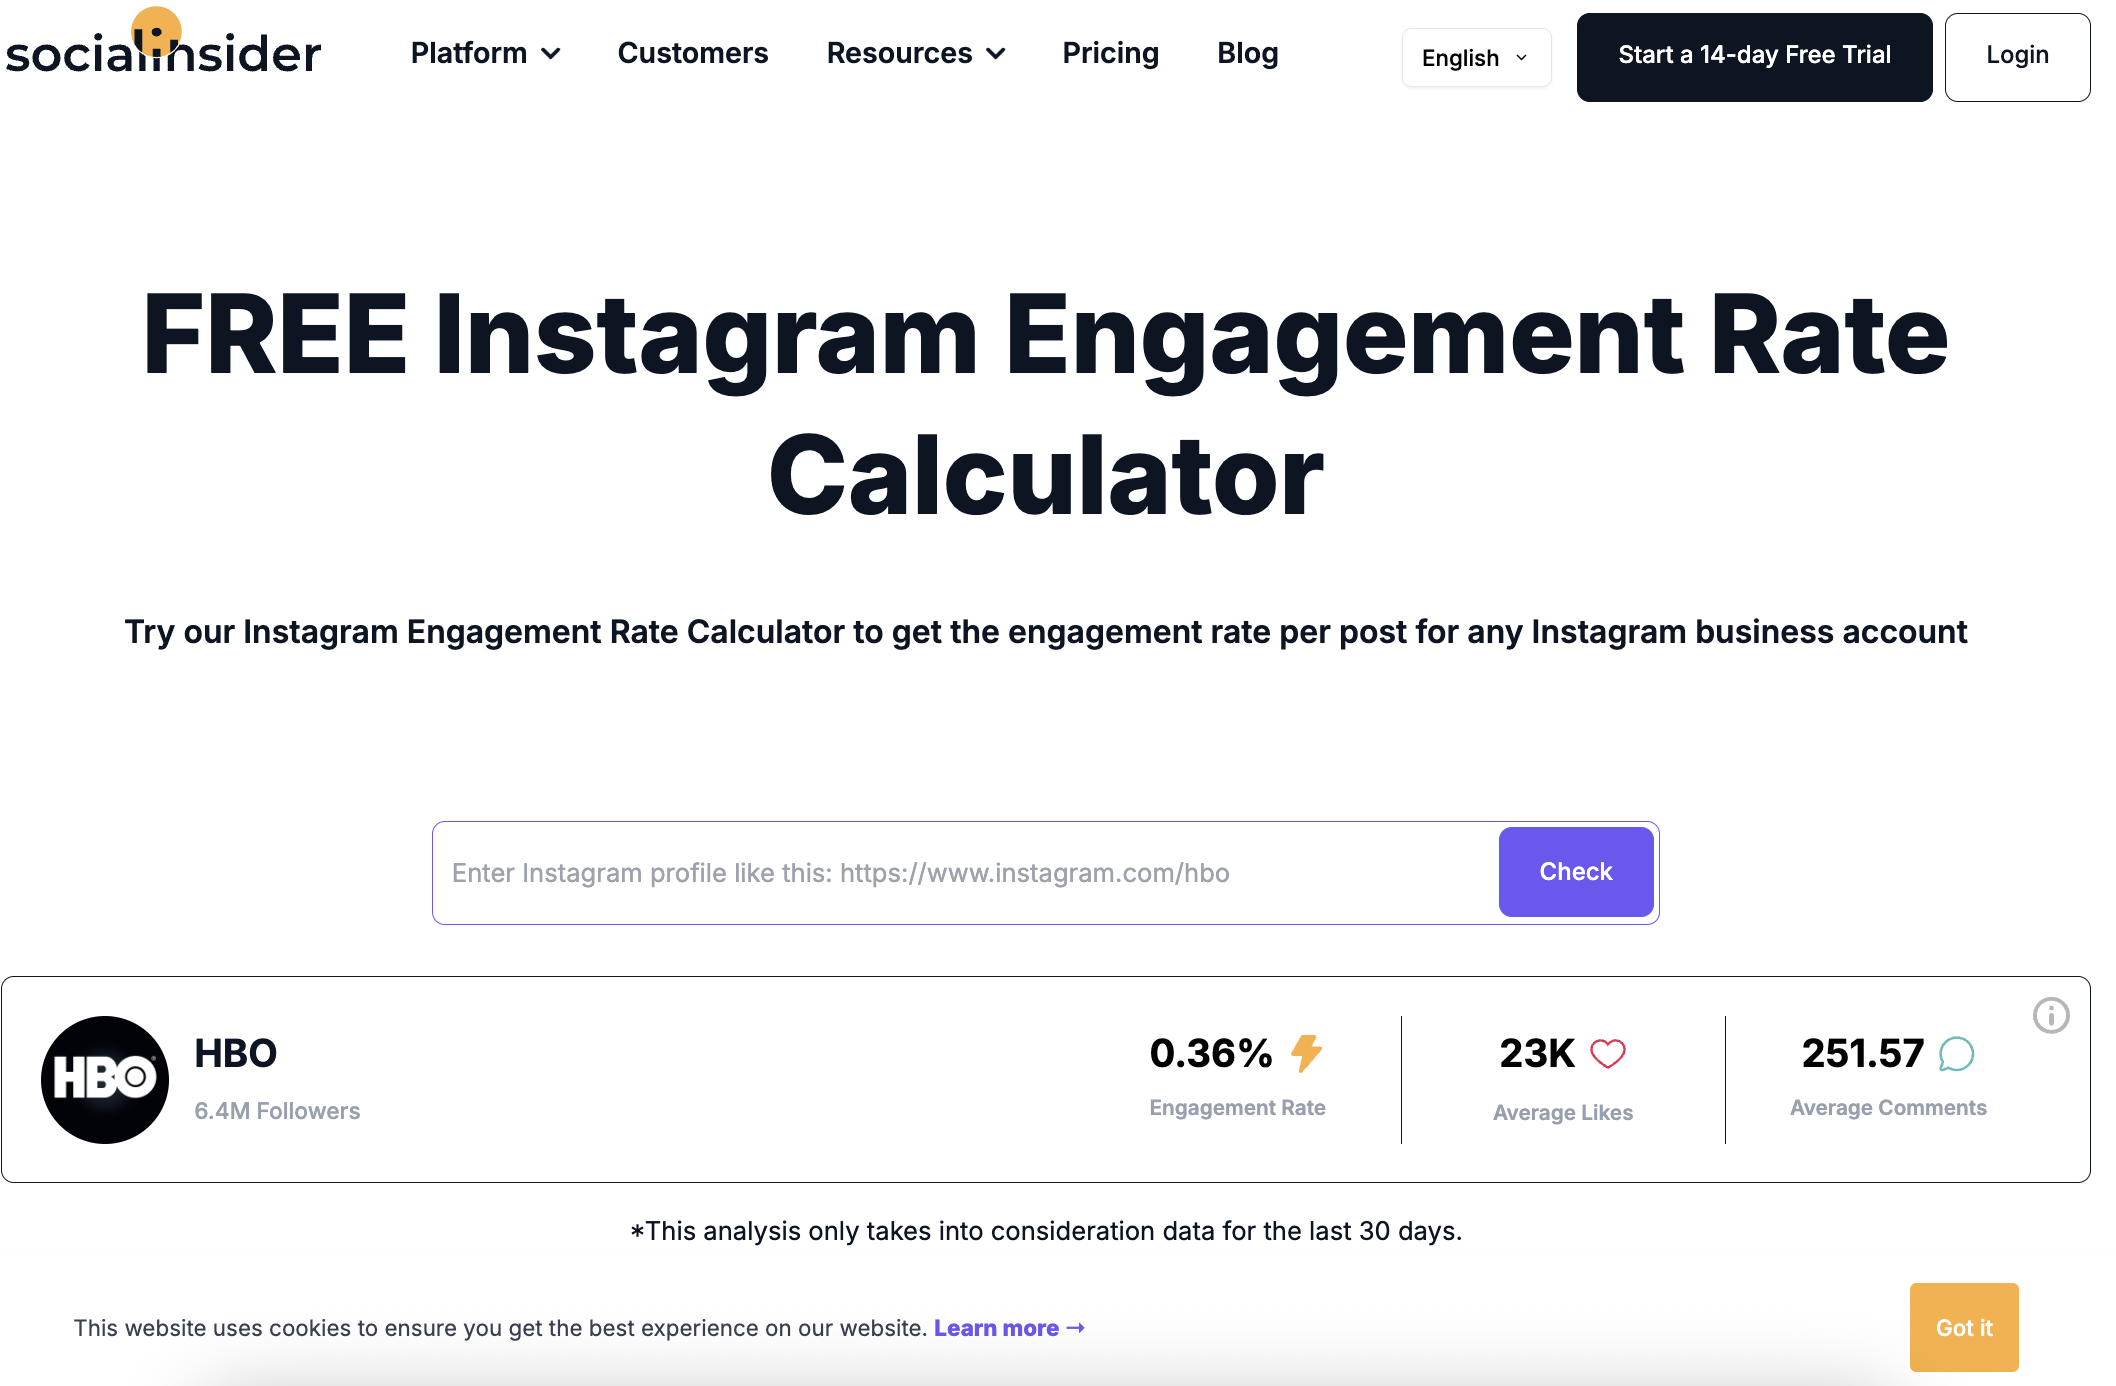 SocialInsider offers a pretty complete collection of free engagement rate calculators for Instagram, YouTube, TikTok, and Facebook. Instead of entering a username, you paste the full profile URL you want to analyze. As long as the account is public and correctly linked, the tool processes it within seconds.
The calculator uses data from the last 30 days, so the result reflects recent activity. It shows engagement rate along with average likes and average comments, which keeps the output simple and focused.
If you need deeper insights other than the basic metrics, SocialInsider directs you to start a free trial of its main analytics platform, where more detailed breakdowns are available.
Use cases
Checking recent engagement on business accounts
Verifying public engagement metrics quickly
Who it’s best for
Brands reviewing active business accounts
Agencies checking recent campaign performance
Creators running business profiles who want a fast overview
Key features
Supports Instagram, TikTok, YouTube, and Facebook
Displays average likes and average comments alongside ER
Designed specifically for business accounts (especially on Instagram)
Pros
Fast loading results
Clear and to-the-point output
Covers multiple major platforms
My experience
It processed the profile within a few seconds after I pasted the URL. The result page shows the engagement rate at the top, followed by average likes and comments, so the key numbers are easy to spot right away.
If you want to try one of SocialInsider’s tools, it’s important to note that, especially on Instagram, the profile needs to be a business account. When I tested a few personal accounts, the calculator couldn’t retrieve the data and didn’t return results.
Meanwhile, the output is minimal and focused. You get the core numbers, but nothing more. It works well if you just need to confirm recent engagement, though it doesn’t provide much context outside that.
Test period
February 2026
Pricing
Free
| Tool name | Socialinsider |
|---|---|
| Input needed | Full profile URL |
| Login needed | No |
| Output | Engagement rate + average interactions |
| Post sample | Not stated |
| Export | None |
| Usage limit | No |
| Update frequency/data last update | No |
3. Postplanify
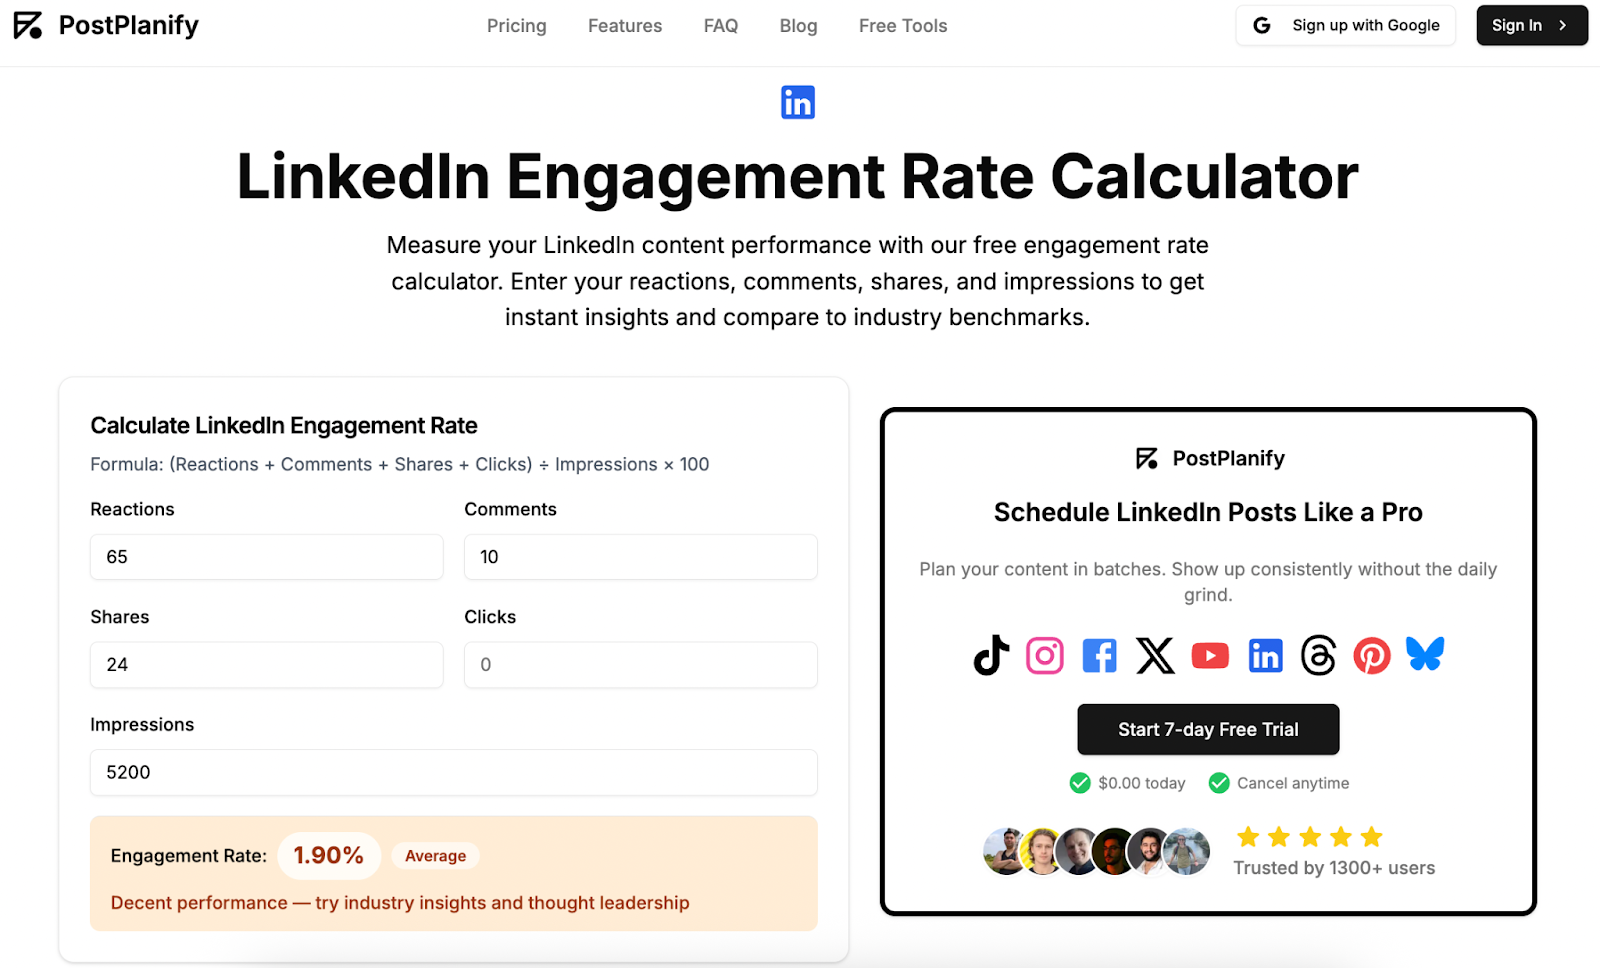 This calculator works differently from tools that automatically pull profile data. Instead, you enter the numbers yourself, including reactions, comments, shares, clicks, likes, followers, or views, depending on the platform. It’s available in four versions: Instagram, TikTok, YouTube, and LinkedIn.
For TikTok, you can choose to calculate engagement rate based on followers or views. On YouTube, there are two options: per view, which helps when comparing video performance, and per subscriber, which reflects subscriber engagement. The result displays the engagement rate along with a simple label showing whether it’s excellent, average, or low.
In addition to the calculator itself, each page includes updated 2026 engagement rate benchmarks. These are grouped by follower count, industry, and content type, which helps put the calculated number into perspective.
There’s also supporting material on the page, including engagement guides, key takeaways, and practical notes.
Use cases
Calculating engagement for a specific post
Verifying engagement numbers when you already have the metrics
Testing different calculation bases such as per view versus per follower
Who it’s best for
Brands reviewing individual sponsored posts
Agencies working with campaign reports
Creators who want to calculate engagement for specific content pieces
Key features
Supports Instagram, TikTok, YouTube, and LinkedIn
Manual input of engagement and audience metrics
TikTok option to calculate by followers or views
YouTube option to calculate per view or per subscriber
Engagement rate benchmarks for 2026
Pros
Various platforms coverage
Fully free and easy to use
Real-time calculation without loading delays
My experience
It’s easy and straightforward to use, but I had to make sure I already had all the numbers ready since a username alone isn’t enough. Because the tool doesn’t pull data automatically, I manually entered the metrics for each post.
That semi-manual setup actually makes it work instantly. There’s no waiting for profile scanning or data processing. As soon as I input the numbers, the engagement rate appeared. At least I didn’t have to write out the formula and calculate it myself.
The page feels smooth and clean, and the layout is intuitive. Since the calculation is based on per-post input, it only shows the engagement rate and doesn’t include additional breakdowns like average likes or comments. It analyzes each post individually rather than the whole account.
The result feels reliable because it’s based entirely on the numbers I provide. There’s no external data involved, so as long as the inputs are correct, the output stays consistent and free from bias.
Test period
February 2026
Pricing
Free
4. Hootsuite
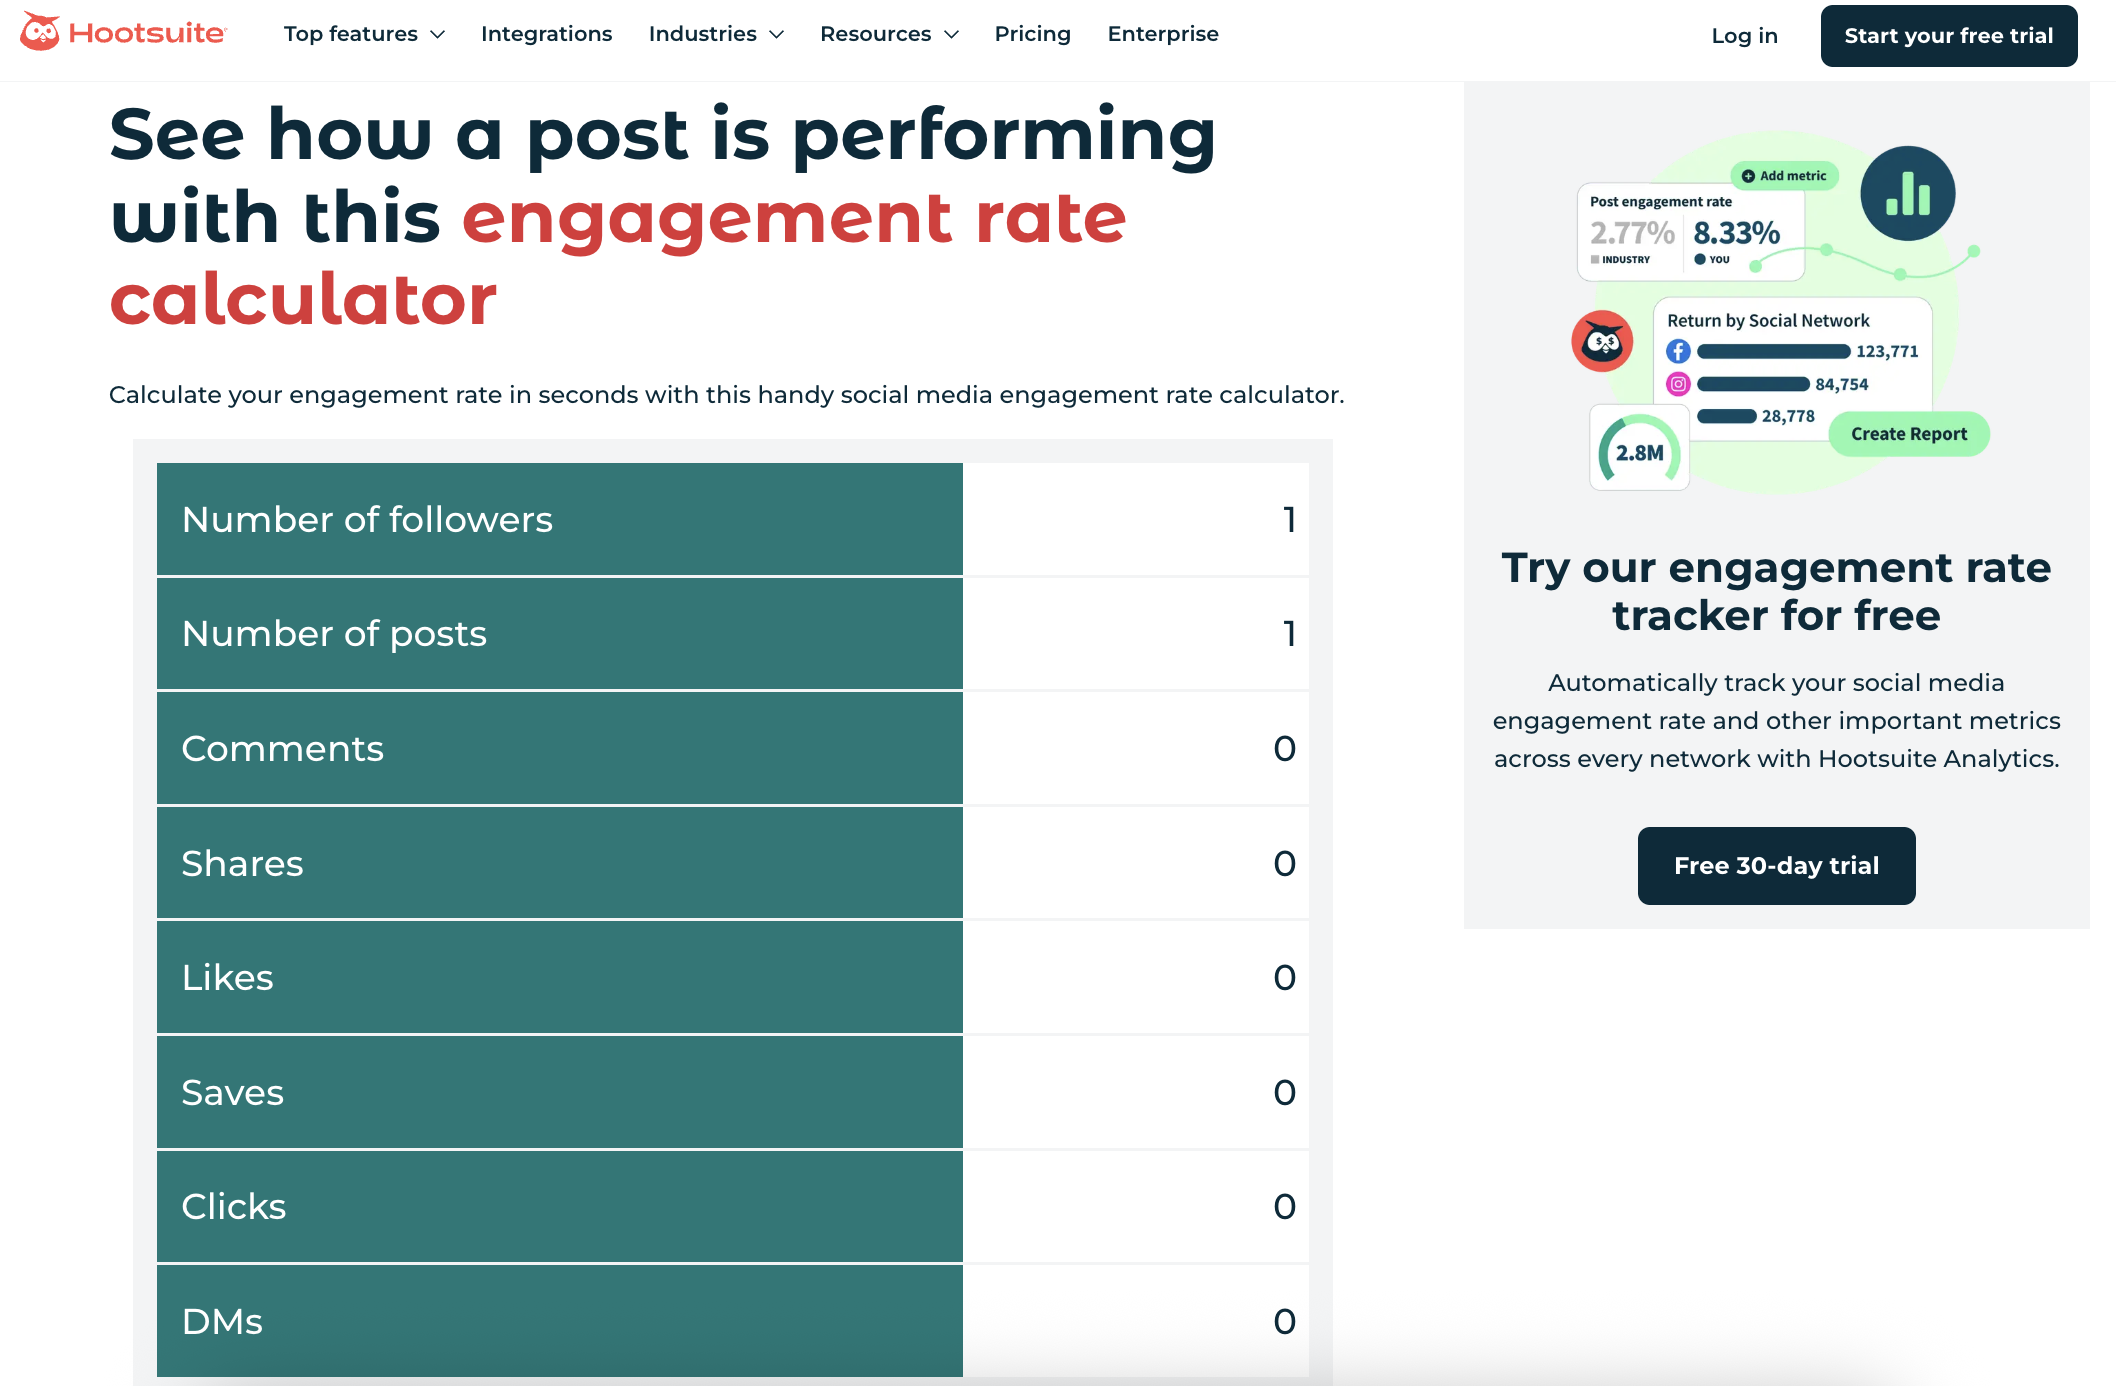 This calculator is built for situations where you already have the post level numbers and just want the engagement rate without doing the math yourself. Just like the third platform in this article, you manually enter metrics like follower count, number of posts, likes, comments, shares, saves, clicks, and DMs. Hootsuite positions it as a way to measure a single post, multiple posts, or even a campaign or time period if you aggregate the totals.
It’s useful if you want to avoid calculating engagement rate manually, especially when evaluating individual posts. For brands and agencies working with influencers, the workflow may require a bit more coordination, since the necessary metrics need to be collected directly from creators. Compared to username-based tools, this can add an extra step to the process.
Use cases
Calculating engagement rate for a single post when you have the metrics on hand
Rolling up engagement across multiple posts for a campaign recap
Internal performance checks for brand owned accounts where clicks and DMs are accessible
Who it’s best for
In-house social teams checking their own posts
Creators who can access metrics like clicks and DMs
Anyone compiling campaign reports from platform analytics
Key features
Includes a wider set of interactions if you want, not just likes and comments
Step-by-step guidance on what to collect and how to use the tool
Pros
Free and simple to run once you have the numbers
Flexible for single posts and multi post recaps
My experience
The page is clean and easy to understand, but I quickly realized it only works smoothly if I already have all the numbers prepared. When I tried using it to reflect overall account performance, I had to total up likes, comments, shares, and saves across multiple posts myself, and that part felt time consuming.
Clicks and DMs were the most difficult fields. Those aren’t always easy to access, especially if I’m evaluating an influencer and don’t control the account. I would need to ask them for those numbers first. It’s helpful that not every field is mandatory, and I could leave some at 0, but gathering everything still requires extra effort.
In the end, the tool gives a single engagement rate number. It does what it promises, but without additional breakdowns or surrounding metrics, I found it harder to draw a strong conclusion from that number alone.
Test period
February 2026
Pricing
Free
| Tool name | Hootsuite |
|---|---|
| Input needed | Numbers |
| Login needed | No |
| Output | Engagement Rate |
| Post sample | Depends on user |
| Export | No |
| Usage limit | No |
| Update frequency/data last update | Not needed |
5. Phlanx
 Phlanx is one of the few sites that splits its engagement calculators into two tracks: basic and advanced, and both are available for free without login. The basic calculators cover several platforms (including TikTok, YouTube, and X), plus an “influencer engagement” calculator that is not tied to a single platform.
For the platform-specific basic calculators, you enter a username or handle and get an engagement rate result. Phlanx also places the account into an engagement tier based on the percentage you get, which helps you read the number faster without guessing what “good” looks like.
The influencer engagement calculator works differently. It lets you calculate engagement across up to 12 posts by entering likes and comments manually, then adds a short explanation of possible reasons an engagement rate looks high or low. That extra explanation is simple, but it gives a bit more direction than a standalone percentage.
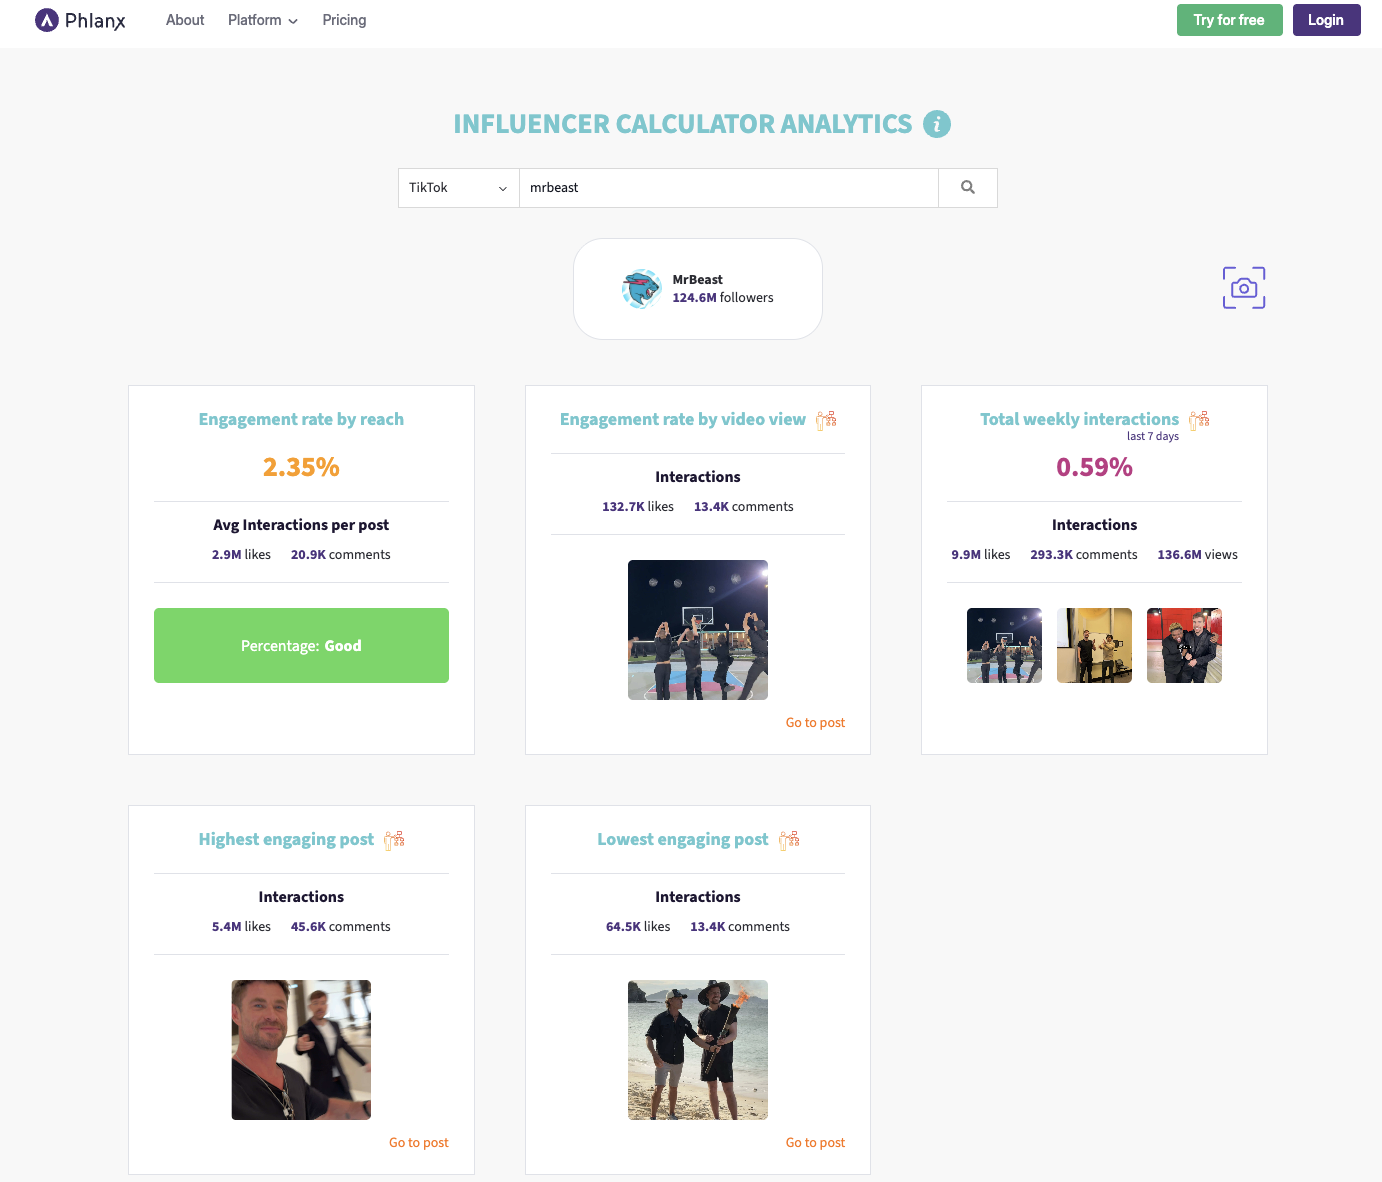
Then there’s the advanced TikTok calculator, which goes further than the basic version. After you enter a username, it returns multiple engagement views, including engagement rate by reach, engagement rate by video view, total weekly interactions, and highlights the highest and lowest engaging posts.
Use cases
Getting a fast engagement read on TikTok, YouTube, or X without logging in
Getting a deeper TikTok view when you want more than one engagement perspective
Doing a lightweight check on Twitch or Kick when you need a quick baseline
Calculating a clean engagement number for a set of posts when you already have like and comment counts
Who it’s best for
Brands doing early screening and need a fast ER check
Agencies who want a simple second opinion tool in their workflow
Creators who want a quick public-facing engagement read without a login
Key features
Two calculator types: basic and advanced, both free and no login
Basic calculators available for multiple platforms plus a platform-agnostic influencer calculator
Advanced TikTok output includes ER by reach, ER by video view, weekly interactions, and highest and lowest engaging posts
Pros
Broad coverage for a free calculator set
Lets you choose between a fast basic check and a deeper TikTok view
The influencer calculator supports multi-post inputs, which is handy for quick post set checks
My experience
I liked that I could use the basic calculators right away without logging in. For the platform-specific pages, typing a handle was enough to get an engagement rate result, and the tier label helped me read the number faster.
The influencer calculator felt different in a good way. Since I could enter likes and comments for multiple posts at once, it was useful when I already had post numbers and just wanted the ER calculated cleanly. The short explanations about why the ER might be high or low were helpful for understanding the result, even though they remain fairly general.
The most useful part for me was the advanced TikTok calculator because it did not stop at one engagement number. Seeing ER by reach and ER by video views side by side, plus weekly interactions and the highest and lowest posts, gave me more to work with when I wanted a deeper read without switching tools.
Test period
February 2026
Pricing
Free
| Tool name | Phlanx |
|---|---|
| Input needed | Some need username, some need manual like & comment input |
| Login needed | No |
| Output | Engagement rate, Creator’s position against average ER, Total weekly interactions (advanced), Highest & lowest engaging post (advanced) |
| Post sample | Not stated |
| Export | No |
| Usage limit | Yes, 3 searches/day |
| Update frequency/data last update | Not stated |
6. SocialCat
 Another platform that only requires user to enter a public username to get instant results, with no sign-up required: SocialCat. The calculators are available for TikTok and Instagram, with a frequently-updated database that keeps the numbers relevant.
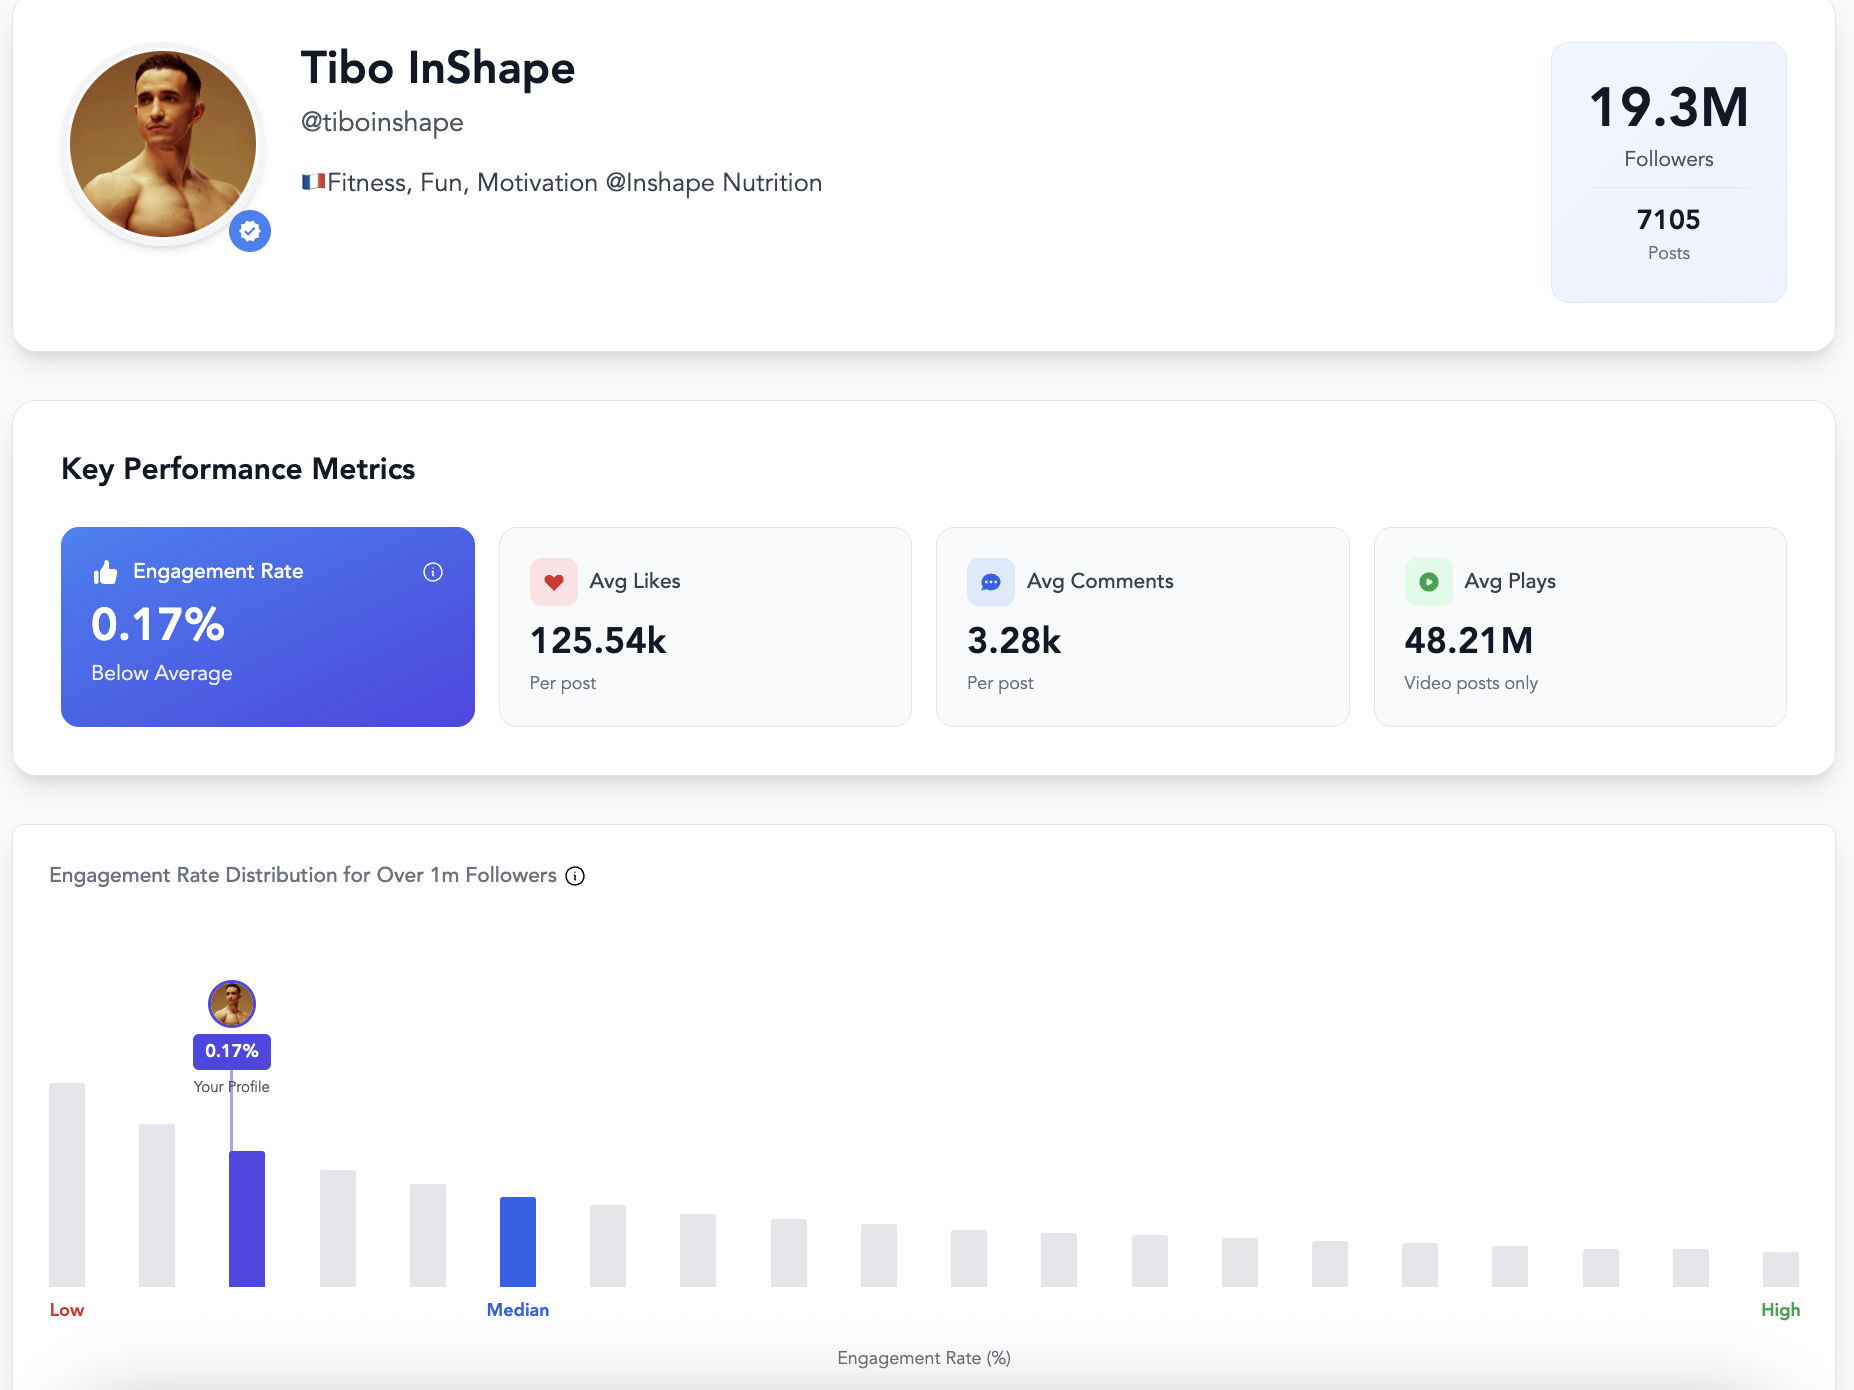
In addition to engagement rate, it shows average likes, average comments, and average video plays. What makes it stand out is the comparison element. The tool places the creator’s engagement rate against others in the same size tier, making it easier to see whether the account is performing above or below the median.
The Instagram version also analyzes the six most recent posts and calculates individual engagement rates for each. This gives you a clearer look at recent post-level performance rather than relying only on an overall number.
SocialCat also includes benchmark tables by industry, tier, and platform, which help users understand how a profile compares within its category.
Use cases
Comparing a creator’s engagement against others in the same tier
Reviewing recent post-level performance on Instagram
Getting a visual overview of a profile before deeper research
Who it’s best for
Brands shortlisting influencers
Agencies evaluating multiple creators
Creators who want to see how they rank within their size tier
Key features
Username-based search with no sign-up required
Displays engagement rate, average likes, average comments, and average plays
Tier-based engagement comparison against median benchmarks
Benchmark tables categorized by industry, tier, and platform
Pros
Strong visual presentation of results
Clear benchmarking against similar-sized accounts
Includes post-level engagement analysis on Instagram
Free and accessible
My experience
SocialCat’s tools have one of the nicest visual presentations among the calculators I tested. It doesn’t just show the engagement rate. It displays the full profile preview, including bio, niche, and even estimated age in the Instagram version, which makes the result feel more complete.
As I scrolled through the page, I saw not only the core metrics like engagement rate, average likes, comments, and video plays, but also a benchmark visualization showing where the creator sits compared to the median engagement rate of their tier. That comparison makes the number easier to interpret.
The Instagram post-level analysis also loads quickly despite the amount of visual elements. Even though it only analyzes six recent posts, that already adds useful details for a free tool.
One thing I noticed is that the database update was listed as September 2025, which is about five months before my testing period in February 2026. That suggests some parts of the data may not be fully up to date. At the same time, the tool correctly displayed the most recent posts, including ones published only hours earlier when I checked against the real profile. That creates a slight question about consistency between the stated database update and the live post capture.
Test period
February 2026
Pricing
Free
| Tool name | SocialCat |
|---|---|
| Input needed | Username |
| Login needed | No |
| Output | Engagement rate, Avg. likes, Avg. comments, Avg. plays, Creator’s position against ER benchmark, Latest 6 post analysis |
| Post sample | Last [X] posts (as shown) / Not stated |
| Export | No |
| Usage limit | No |
| Update frequency/data last update | Stated |
7. TrendHERO
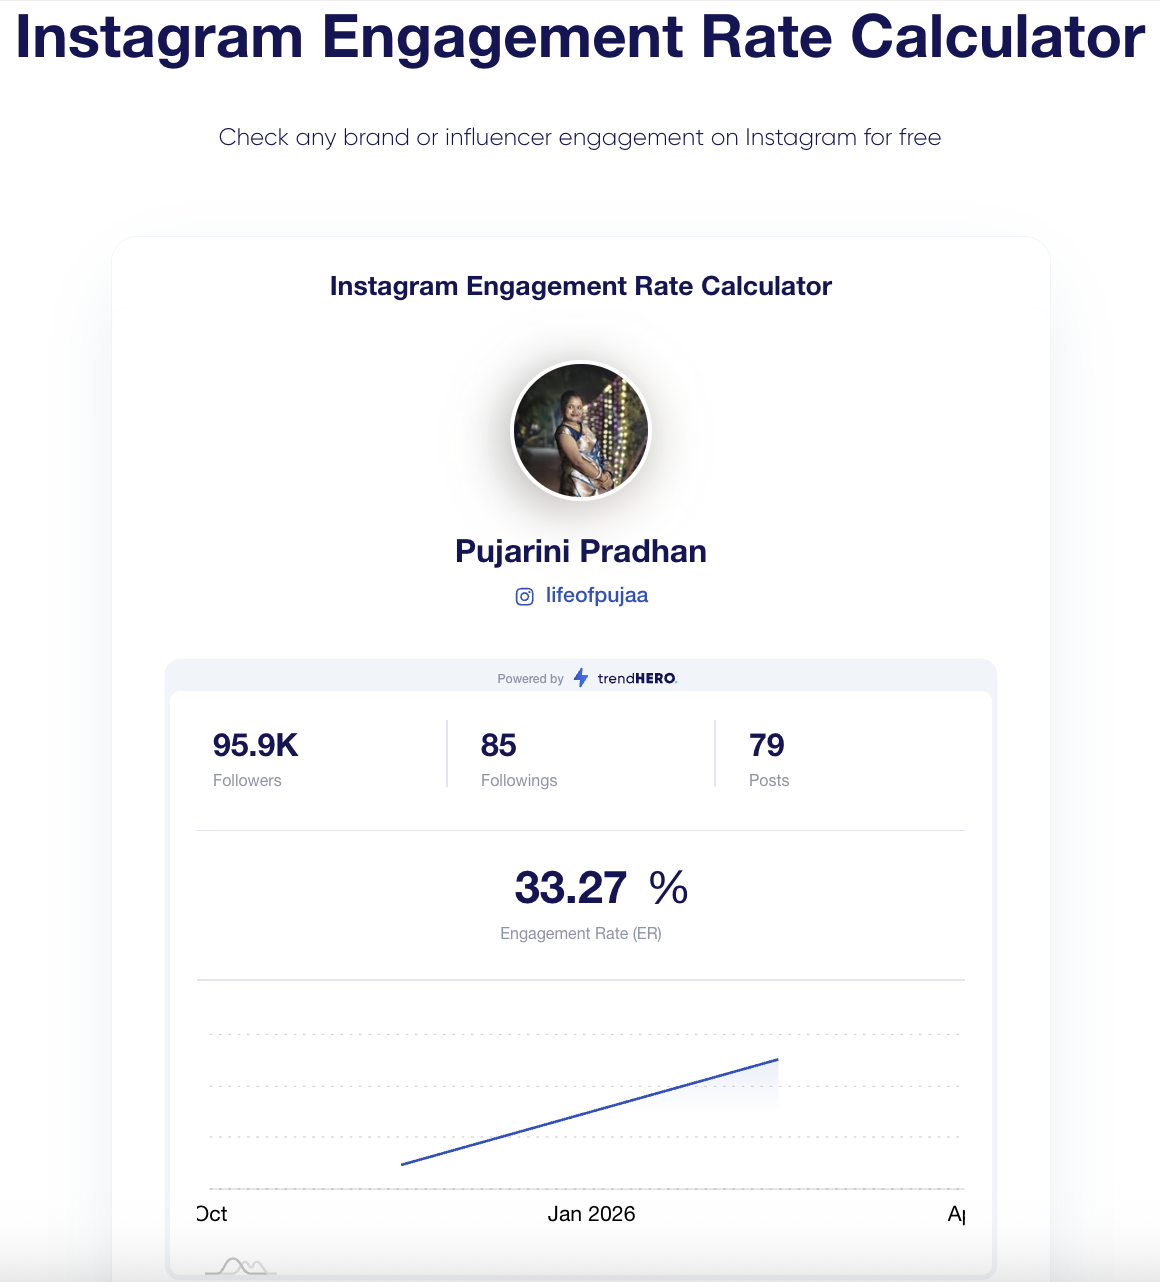 TrendHERO focuses specifically on Instagram and offers a free engagement rate calculator that works without any login. To use it, you simply enter the profile you want to check, and the tool handles the rest.
The calculator analyzes up to 18 recent posts. According to TrendHERO, the number is enough to understand engagement rate for most account types, from creators who post once a week to high-volume fan pages. If an account has fewer than 18 posts, the calculation is adjusted based on the available content. This approach makes the results consistent while still flexible for smaller profiles.
In addition to engagement rate, the tool also displays follower count, following count, and total number of posts.
Use cases
Checking engagement rate for Instagram creators
Reviewing recent post performance using a fixed sample size
Who it’s best for
Brands researching Instagram influencers
Agencies running early-stage profile checks
Creators who want to see their engagement rate quickly
Key features
Instagram-specific engagement rate calculator
Displays follower, following, and post counts
Includes a basic growth chart
Pros
Free and no login required
Clear calculation logic based on recent posts
Fast loading results
My experience
The calculator returned the engagement rate for the account I entered, along with a growth chart. However, it wasn’t immediately clear whether the chart represented follower growth or engagement growth, since accessing more details requires signing up.
Besides engagement rate, it showed follower count, following count, and total posts. Some of these numbers matched the live Instagram profile, which suggests the tool pulls relatively recent data. However, for a few accounts, the numbers were slightly different from what I saw directly on Instagram. This makes it important to double-check the live profile when accuracy is critical.
Overall, the calculator is straightforward and simple to use. There isn’t much complexity to it, and loading time was smooth during testing.
Test period
February 2026
Pricing
Free
| Tool name | TrendHERO |
|---|---|
| Input needed | Username |
| Login needed | No |
| Output | Engagement rate, Follower, following, and post count, Growth curve |
| Post sample | Last 18 posts |
| Export | No |
| Usage limit | No |
| Update frequency/data last update | Not stated |
Best ER Calculator
After testing these engagement rate calculators, I kept coming back to the same thing: the formula matters less than the inputs and the sampling behind it. Some tools pull recent posts and try to smooth out spikes. Others are fully manual, so the result is only as good as the numbers you enter. A few add benchmarks or tier comparisons, which helps a lot when you do not want to stare at a percentage and guess what it means.
Here’s a short table to recap what each tool did best and where it felt limited.
| Platform | Strength | Limitation | Best Use Case |
|---|---|---|---|
| HypeAuditor | Stable ER view with extra context metrics | Some deeper report sections gated | Cross-platform influencer screening |
| SocialInsider | Clean 30-day view with simple outputs | Business account limitation can block analysis | Recent 30-day business account checks |
| PostPlanify | Manual inputs with useful 2026 benchmarks | No auto data pull, post-level only | Per-post manual ER calculation |
| Hootsuite | Flexible for single post or aggregated totals | Requires lots of inputs, clicks and DMs are hard to source | Campaign-level ER from owned data |
| Phlanx | Wide platform coverage plus advanced TikTok views | Calculation basis not clearly stated across tools | Multi-platform quick ER checks |
| SocialCat | Strong visuals with tier benchmarking and post view | “Last update” messaging can be confusing | Tier-based visual benchmarking |
| TrendHERO | Simple Instagram check based on recent posts | Calculation basis not stated, some profile numbers may lag | Instagram recent-post ER checks |
FAQs
Why do engagement rates differ across platforms?
Because platforms reward different actions and people use them differently. On Instagram, saves and shares often matter more than raw likes. On TikTok, views and repeat watches heavily influence what engagement looks like. On YouTube, the gap between views and interactions can be huge, especially for Shorts. Even if two platforms show the same percentage, the underlying behavior can be completely different.
Why can two calculators show different engagement rate values for the same creator?
Most calculators don’t use the same inputs. One tool might analyze the last 12 posts, another the last 30 days, and another uses whatever you manually enter. Some count only likes and comments, while others include shares, saves, clicks, or other interactions. If the post sample, time window, or included actions change, the final ER number will change too.
Is engagement rate still relevant in 2026?
Yes, but mostly as a starting point. ER is still useful for cross-checking performance, spotting outliers, and comparing creators inside the same platform and format. It becomes less useful when it’s treated as a universal KPI across platforms, or when it’s used alone without looking at other factors like growth, reach, and content consistency.
Median vs average engagement rate: what’s the practical difference?
An average can get pulled up or down by a few extreme posts, like one viral hit or one underperforming upload. A median is usually steadier because it reflects the middle of the distribution, not the extremes. If you want a “typical post” view, median is often easier to trust. If you want a broad overall number that includes spikes, an average may be acceptable, but you need to know the post sample behind it.
What engagement window should you look at: recent posts, last 30 days, or a longer range?
It depends on what you’re trying to answer. Recent posts are helpful when you care about current momentum or recent content changes. A 30-day window is useful for active accounts with steady posting, but it can mislead for creators who post less often. A longer range is better for stability, but it can hide recent drops or shifts. The main rule is to match the window to the decision you’re making.
Which engagement metrics should brands trust most?
Trust metrics you can verify consistently across creators and campaigns. For most use cases, that means a combination of engagement rate, average interactions per post, and a view-based metric when views drive value (especially on TikTok and YouTube). Saves, shares, and comments often indicate stronger intent than likes, but they’re not always available or comparable across platforms. If clicks, DMs, or conversions matter, treat them as creator-provided unless you have direct access to campaign tracking.
When does engagement rate become misleading?
When the post sample is too small, when one viral post dominates the average, or when the account is in a transition period (format change, content shift, sudden follower growth). It can also mislead when you compare ER across platforms as if they work the same way. If the calculator doesn’t show how many posts it used, what interactions it counted, or how recent the data is, treat the number as a rough indicator, not a final answer.