



NUMÉRO 4, AOÛT 2026
HypeAuditor Digest
Des analyses fraîches, des tendances et les dernières actus

MISES À JOUR PRODUIT
Les nouveautés chez HypeAuditor
Nous avons mis à jour le calcul du taux d'engagement dans HypeAuditor pour suivre l'évolution de la façon dont les plateformes sociales diffusent le contenu aujourd'hui. À mesure que la façon dont les internautes découvrent le contenu et interagissent avec lui évolue, les métriques que nous utilisons doivent, elles aussi, évoluer.
Voici ce qui a changé, pourquoi nous avons fait cette mise à jour, et ce que cela signifie pour les chiffres d'ER que vous voyez dans nos rapports.
La nouvelle formule
Dans l'ensemble de nos rapports d'influenceurs, HypeAuditor sélectionne désormais le type de contenu le plus pertinent avant de calculer l'ER.
Pour les comptes disposant d'assez de reels ou de contenu vidéo, nous utilisons un calcul basé sur les vues :
ER = (Mentions J'aime + Commentaires) / Vues × 100 %
Quand il n'y a pas assez de contenu vidéo, nous utilisons le calcul basé sur les publications :
ER = (Mentions J'aime + Commentaires) / Abonnés × 100 %.
Dans les deux cas, nous calculons l'ER pour chaque contenu individuellement, puis utilisons la médiane pour donner une image plus représentative des performances récentes.
ACTUALITÉS MARKETING
Ce que nous partageons en ce moment
Chaque mois est une nouvelle occasion de créer quelque chose d'utile et qui mérite d'être partagé. Et ce mois-ci, on vous a préparé quelque chose d'un peu différent. On pense que ça pourrait bien vous être utile.
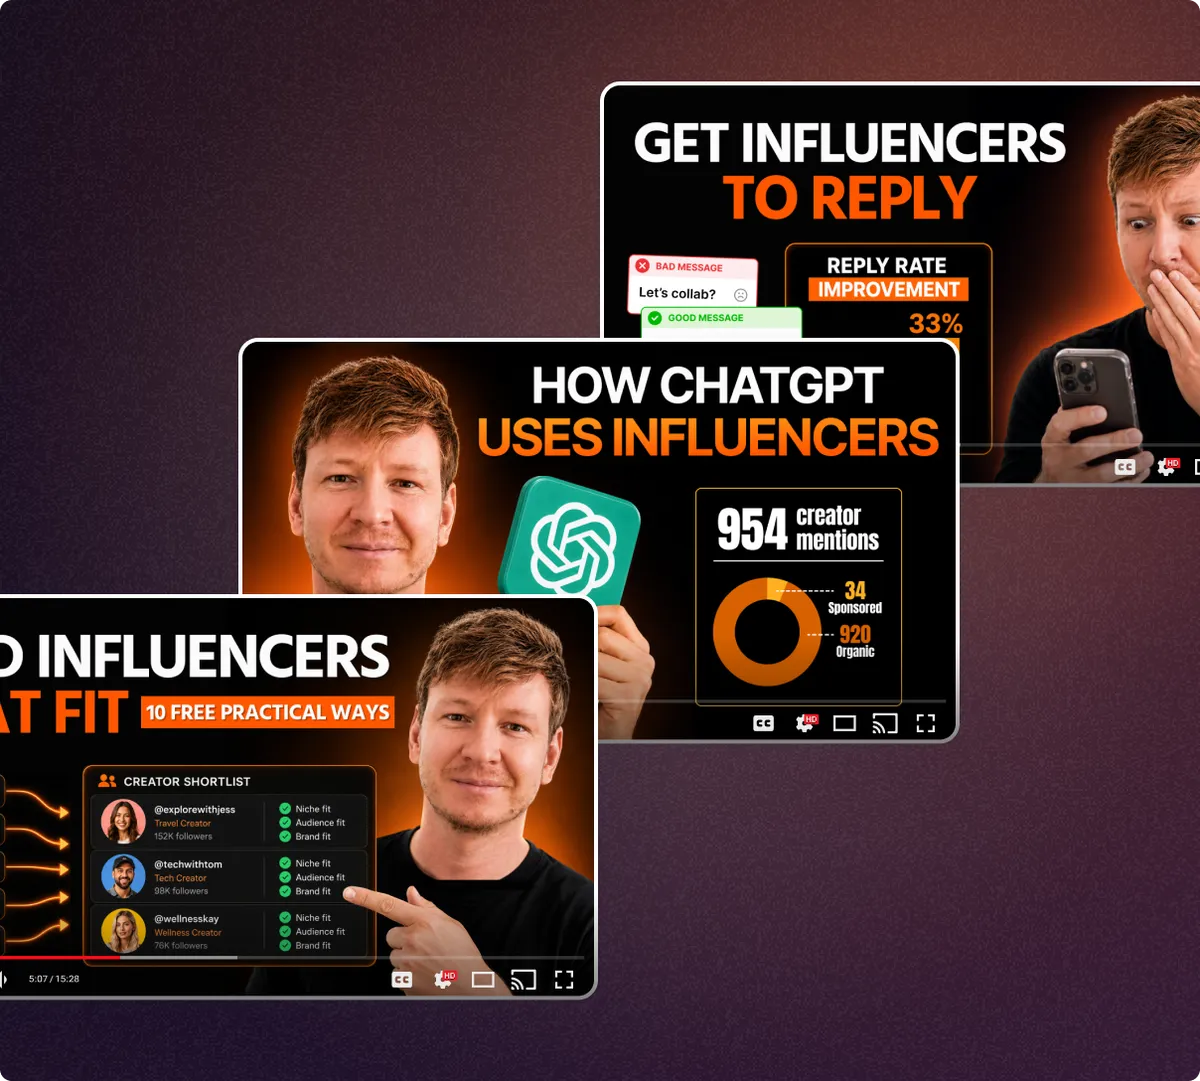
Les nouveautés de la chaîne YouTube du CEO
Ce mois-ci, Alex Frolov s'attaque à peu près à tout ce que les marketeurs rencontrent dans leurs campagnes d'influence : trouver les bons créateurs, obtenir une réponse de leur part, et comprendre ce qu'on peut apprendre des choix de marketing créateur les plus malins d'une autre grande marque. À vous de choisir votre prochaine vidéo :
Comment trouver des influenceurs rapidement (10 méthodes concrètes qui fonctionnent)Stratégie de prise de contact avec les influenceurs : comment obtenir plus de 30 % de taux de réponseComment OpenAI utilise le marketing créateur (analyse de sa stratégie) 📊Un cours gratuit pour bien débuter
Si vous débutez dans le marketing d'influence, ou si vous formez quelqu'un qui débute, nous venons de lancer un cours par e-mail entièrement gratuit, conçu pour ça. Sept leçons arrivent dans votre boîte mail, une par jour, chacune assez courte pour se lire pendant une pause, racontées par un chat pirate plutôt drôle, histoire que ça ne ressemble jamais vraiment à des devoirs. Difficile de faire mieux, non ?
S'inscrire au cours gratuit
COUP DE PROJECTEUR DU MOIS
Les vraies raisons pour lesquelles le taux d'engagement compte en marketing d'influence
5 raisons pour lesquelles l'ER reste utile en marketing d'influence

Cela dit, l'ER n'est qu'une métrique parmi d'autres, pas un verdict à elle seule
Il n'existe pas de « bon » taux d'engagement universel, et aucun chiffre à lui seul ne devrait décider d'une présélection de créateurs. Comparez l'ER à des benchmarks pertinents, puis examinez les vues, la qualité de l'audience, l'adéquation du contenu et l'objectif de votre campagne pour une vision plus complète.
LE COIN DE L'ANALYSTE
La bonne façon d'évaluer le taux d'engagement d'un créateur
Un chiffre d'ER pris isolément ne vous dit pas grand-chose, à moins de comprendre sur quoi il repose et à quoi ressemble un résultat typique pour des créateurs comparables.
Pour ce benchmark, je me concentre sur le taux d'engagement basé sur les vues
Je trouve cette approche particulièrement utile pour les reels, car le nombre d'abonnés seul devient de moins en moins révélateur de la diffusion qu'un créateur peut réellement générer. C'est pourquoi je regarde toujours deux métriques ensemble : la médiane des vues moyennes et la médiane du taux d'engagement.

Comment utiliser ce benchmark
La façon la plus simple d'utiliser ce benchmark consiste à prendre un créateur que vous envisagez et à le comparer à des créateurs de taille similaire sur le même marché. Le tableau ci-dessous détaille les deux métriques par pays et par tranche d'abonnés.
The easiest way to use the benchmark is to take a creator you are considering and compare them with creators of a similar size in the same market. The table below breaks both metrics down by country and follower tier.
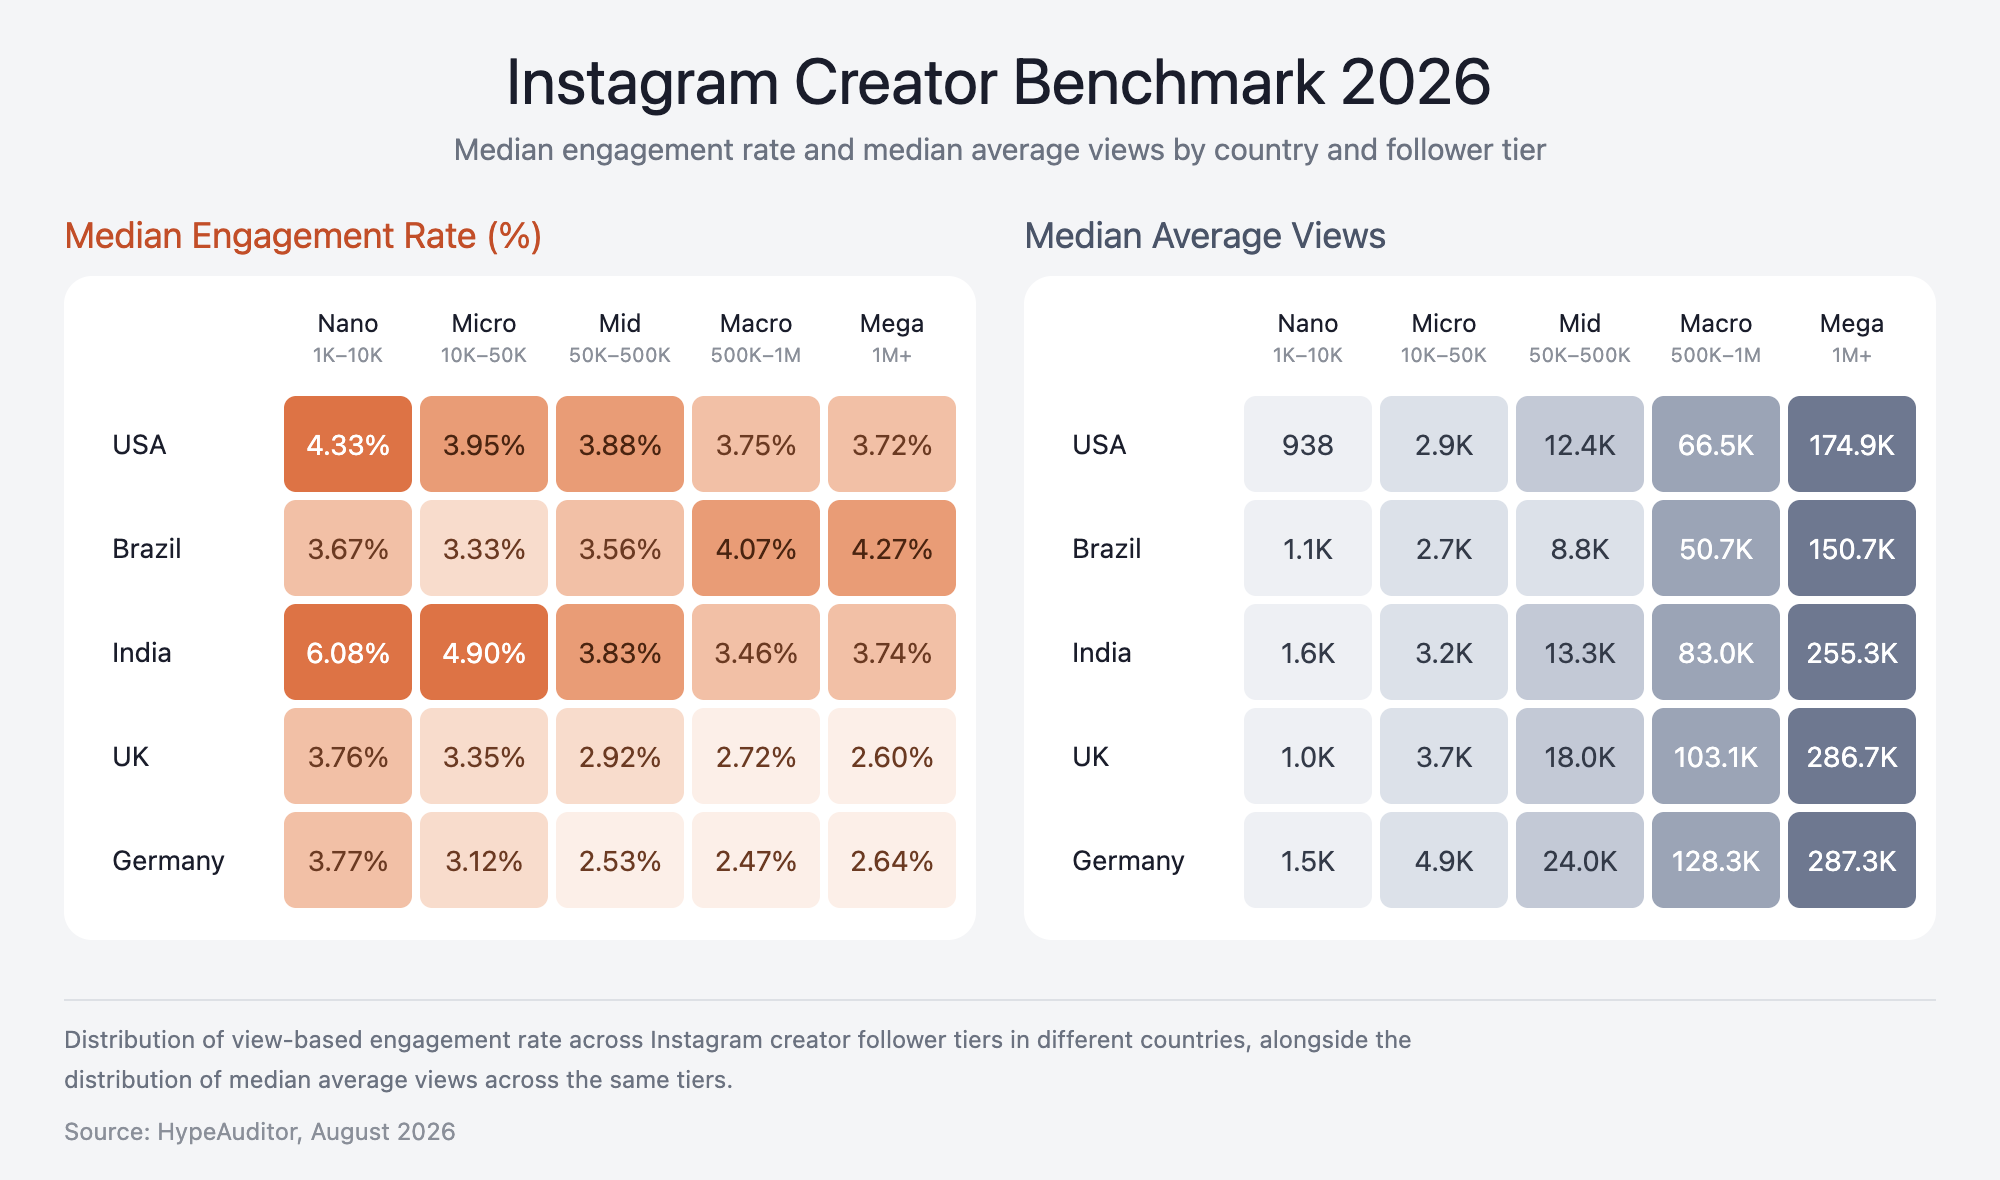
For example, among US creators with 50K–500K followers, our benchmark shows a 3.88% median Engagement Rate, with median Average Views of 12.4K.
These are medians, not targets or minimum requirements. A median simply means that roughly half of comparable creators are above that level and half are below it.
Now imagine you are considering a US creator with 150K followers who averages 30K views and has a view-based ER of 5%.
Both metrics are above the median for comparable creators.
That doesn't automatically mean you should sign them, but it's a useful indicator that their content is outperforming peers of a similar size in the same market, and a good reason to shortlist them for a closer look.
Vues et ER ne racontent pas la même chose
I would not use either metric in isolation.
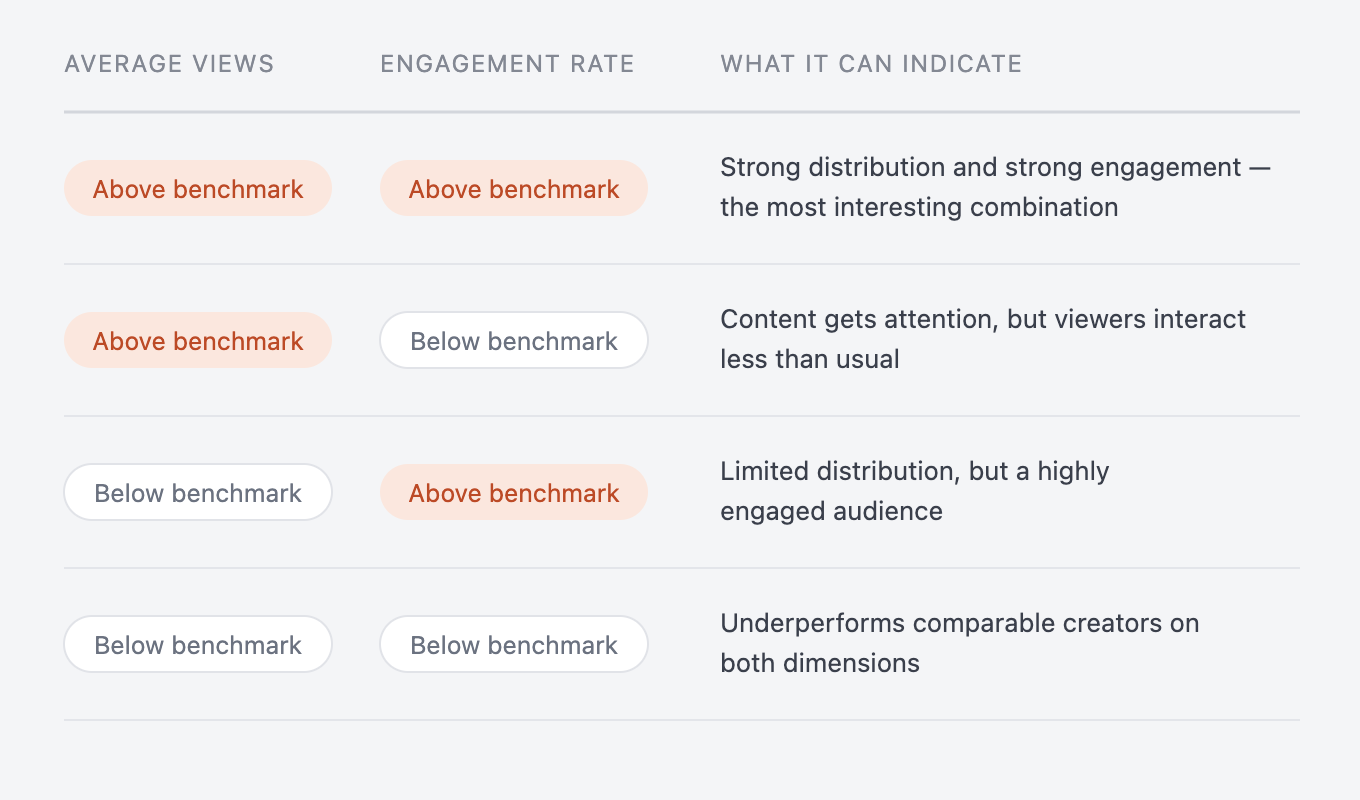
Average Views tells you about distribution power: how much attention the creator’s content typically manages to generate.
Engagement Rate tells you about engagement efficiency: how strongly people interact with the content once it reaches them.
Looking at both gives you a more useful read on where a creator stands:
There is another reason to keep both numbers in mind.
A 3% Engagement Rate on 1,000 views and a 3% Engagement Rate on 100,000 views represent very different levels of audience response.
The percentage may be identical, but the absolute scale of engagement is not.
Utiliser la performance organique des reels pour choisir le contenu à amplifier
Brands increasingly take content that's already published organically and put paid media behind it, through Instagram Partnership Ads or similar tools. Organic performance can act as an initial creative signal here.
A Reel that significantly outperforms the typical views for comparable creators has already shown an ability to attract attention without paid distribution. I would start testing with content like this before spending the budget behind weaker performers.
I'd treat this as a creative pre-test, not a guarantee, since targeting, objective, and placement still decide paid results. Given a few assets to pick from, I'd start with whichever already showed it could attract attention on its own.
Un engagement élevé ne veut pas forcément dire un engagement positif
There is one more thing that benchmarks cannot tell us.
A high Engagement Rate tells you that people are reacting. It does not tell you why they are reacting.
A Reel may generate lots of comments because people love it. It may also generate lots of comments because it is controversial, confusing or attracting negative reactions.
So once the numbers flag an interesting creator or piece of content, the next step is qualitative: open the Reel, read the comments and understand what exactly is driving the engagement and whether that response is appropriate for your brand.
Un benchmark vous donne un point de comparaison
A 4% Engagement Rate can be strong for one creator and completely normal for another. It depends on factors such as follower size, market, and platform.
That’s why I would compare a creator’s views and ER with similar creators in the same market and follower range, rather than judging the number on its own.
Our benchmark is designed to supply that missing comparison, helping marketers identify creators and Reels that stand out from comparable content before moving on to the equally important questions of brand fit, audience quality, content quality, and campaign objectives.