



AUSGABE 4, AUGUST 2026
HypeAuditor Digest
Frische Einblicke, Trends und Updates

PRODUKT-UPDATES
Das ist neu bei HypeAuditor
Wir haben die Berechnung der Engagement Rate in HypeAuditor aktualisiert, um mit der Art und Weise Schritt zu halten, wie soziale Plattformen Inhalte heute verteilen. Wenn sich verändert, wie Menschen Inhalte entdecken und mit ihnen interagieren, müssen auch die dafür verwendeten Kennzahlen mithalten.
Hier ist, was sich geändert hat, warum wir dieses Update vorgenommen haben und was das für die ER-Zahlen in unseren Berichten bedeutet.
Die neue Formel
In allen unseren Influencer-Berichten wählt HypeAuditor jetzt zunächst den relevantesten Content-Typ aus, bevor die ER berechnet wird.
Für Accounts mit ausreichend Reels oder Video-Content verwenden wir eine aufrufbasierte Berechnung:
ER = (Likes + Kommentare) / Aufrufe × 100 %
Wenn nicht genügend Video-Content vorhanden ist, verwenden wir die postbasierte Berechnung:
ER = (Likes + Kommentare) / Follower × 100 %
In beiden Fällen berechnen wir die ER für einzelne Inhalte und verwenden den Median, um ein repräsentativeres Bild der aktuellen Performance zu liefern.
MARKETING-NEWS
Was wir gerade veröffentlichen
Jeder Monat ist ein neuer Anlass, etwas Nützliches zu schaffen, das es wert ist, geteilt zu werden. Und diesen Monat haben wir etwas, das ein bisschen anders ist als sonst. Wir glauben, es könnte Ihnen gute Dienste leisten.
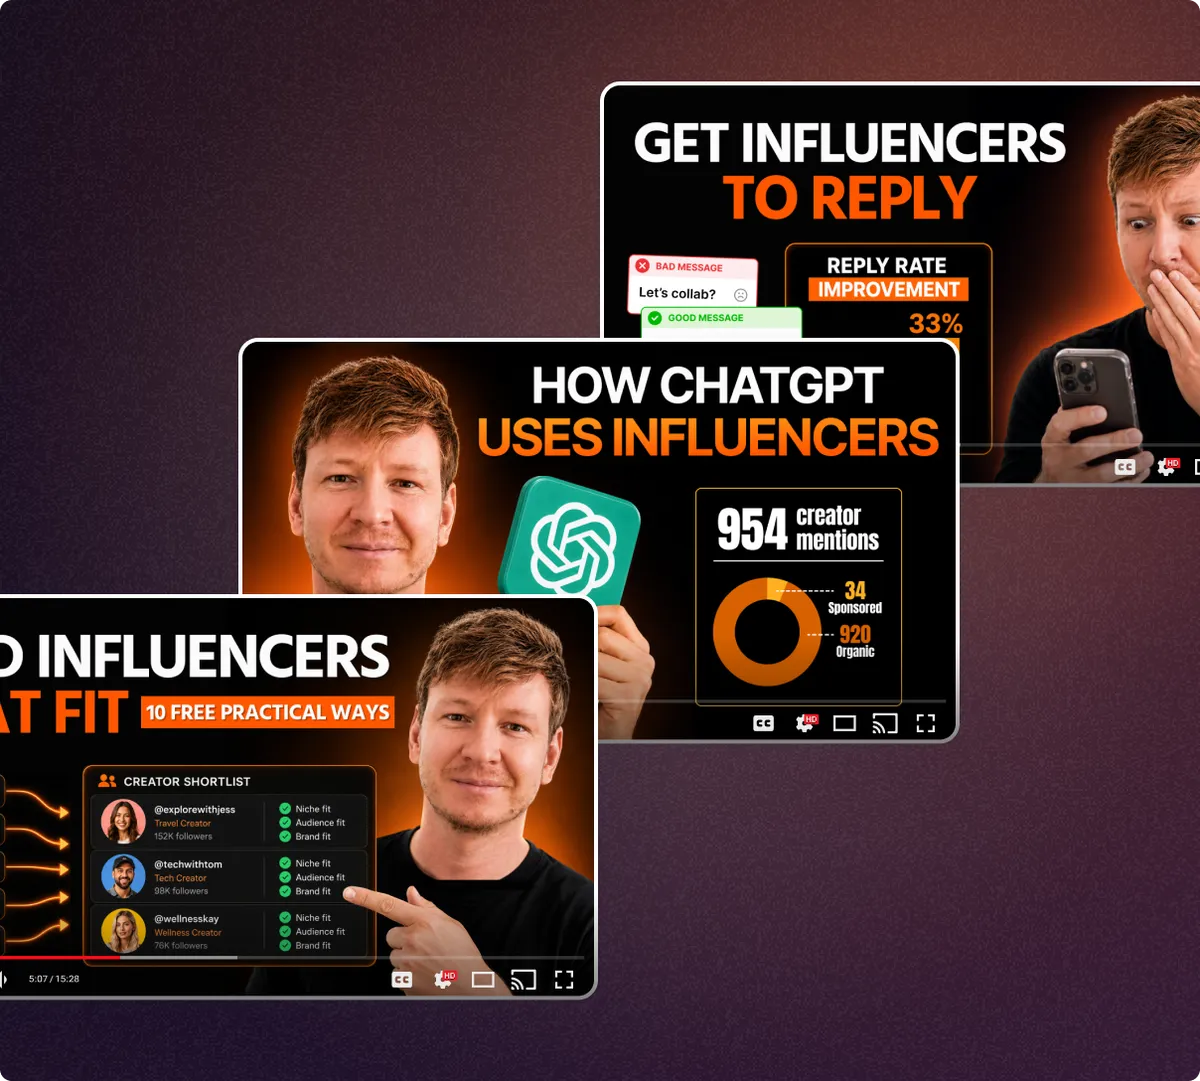
Neues vom YouTube-Kanal des CEOs
Diesen Monat widmet sich Alex Frolov so ziemlich allem, worauf Marketer bei Influencer-Kampagnen stoßen: die richtigen Creator finden, sie zu einer Antwort bewegen und herausfinden, was man von den cleveren Creator-Marketing-Zügen einer anderen bekannten Marke lernen kann. Suchen Sie sich Ihr nächstes Video aus:
Wie Sie Influencer schnell finden (10 praktische Wege, die funktionieren)Influencer-Outreach-Strategie: Wie Sie über 30 % Antwortquote erreichenWie OpenAI Creator-Marketing einsetzt (Strategie-Analyse) 📊Ein kostenloser Kurs für alle, die gerade erst anfangen
Wenn Sie neu im Influencer-Marketing sind, oder gerade jemanden einarbeiten, der es ist, haben wir genau dafür einen komplett kostenlosen E-Mail-Kurs gestartet. Sieben Lektionen landen nacheinander, eine pro Tag, in Ihrem Posteingang, jede kurz genug für eine Pause – erzählt von einer Piratenkatze mit ordentlichem Sinn für Humor, damit es sich nie wirklich wie Hausaufgaben anfühlt. Geht es noch besser?
Jetzt für den kostenlosen Kurs anmelden
IM FOKUS DIESEN MONAT
Die wahren Gründe, warum die Engagement Rate im Influencer-Marketing zählt
5 Gründe, warum die ER im Influencer-Marketing weiterhin nützlich ist

Die ER ist jedoch nur eine Kennzahl, kein vollständiges Urteil
Es gibt keine universell „gute" Engagement Rate, und keine einzelne Zahl sollte über eine Creator-Shortlist entscheiden. Vergleichen Sie die ER mit relevanten Benchmarks, und betrachten Sie zusätzlich Aufrufe, Zielgruppenqualität, Content-Passung und Ihr Kampagnenziel für ein vollständigeres Bild.
DIE ANALYSE-ECKE
Wie man die Engagement Rate eines Creators richtig einschätzt
Eine ER-Zahl allein sagt nicht viel aus, wenn man nicht versteht, worauf sie basiert und wie ein typisches Ergebnis für vergleichbare Creator aussieht.
Für diesen Benchmark konzentriere ich mich auf die aufrufbasierte Engagement Rate
Ich halte diesen Ansatz besonders für Reels für sinnvoll, weil die Follower-Zahl allein immer weniger darüber aussagt, wie viel Distribution ein Creator tatsächlich erzielen kann. Deshalb betrachte ich immer zwei Kennzahlen zusammen: die mediane durchschnittliche Aufrufzahl und die mediane Engagement Rate.

So nutzen Sie den Benchmark
Am einfachsten nutzen Sie den Benchmark, indem Sie einen Creator, den Sie in Betracht ziehen, mit Creators ähnlicher Größe auf demselben Markt vergleichen. Die Tabelle unten schlüsselt beide Kennzahlen nach Land und Follower-Kategorie auf.
The easiest way to use the benchmark is to take a creator you are considering and compare them with creators of a similar size in the same market. The table below breaks both metrics down by country and follower tier.
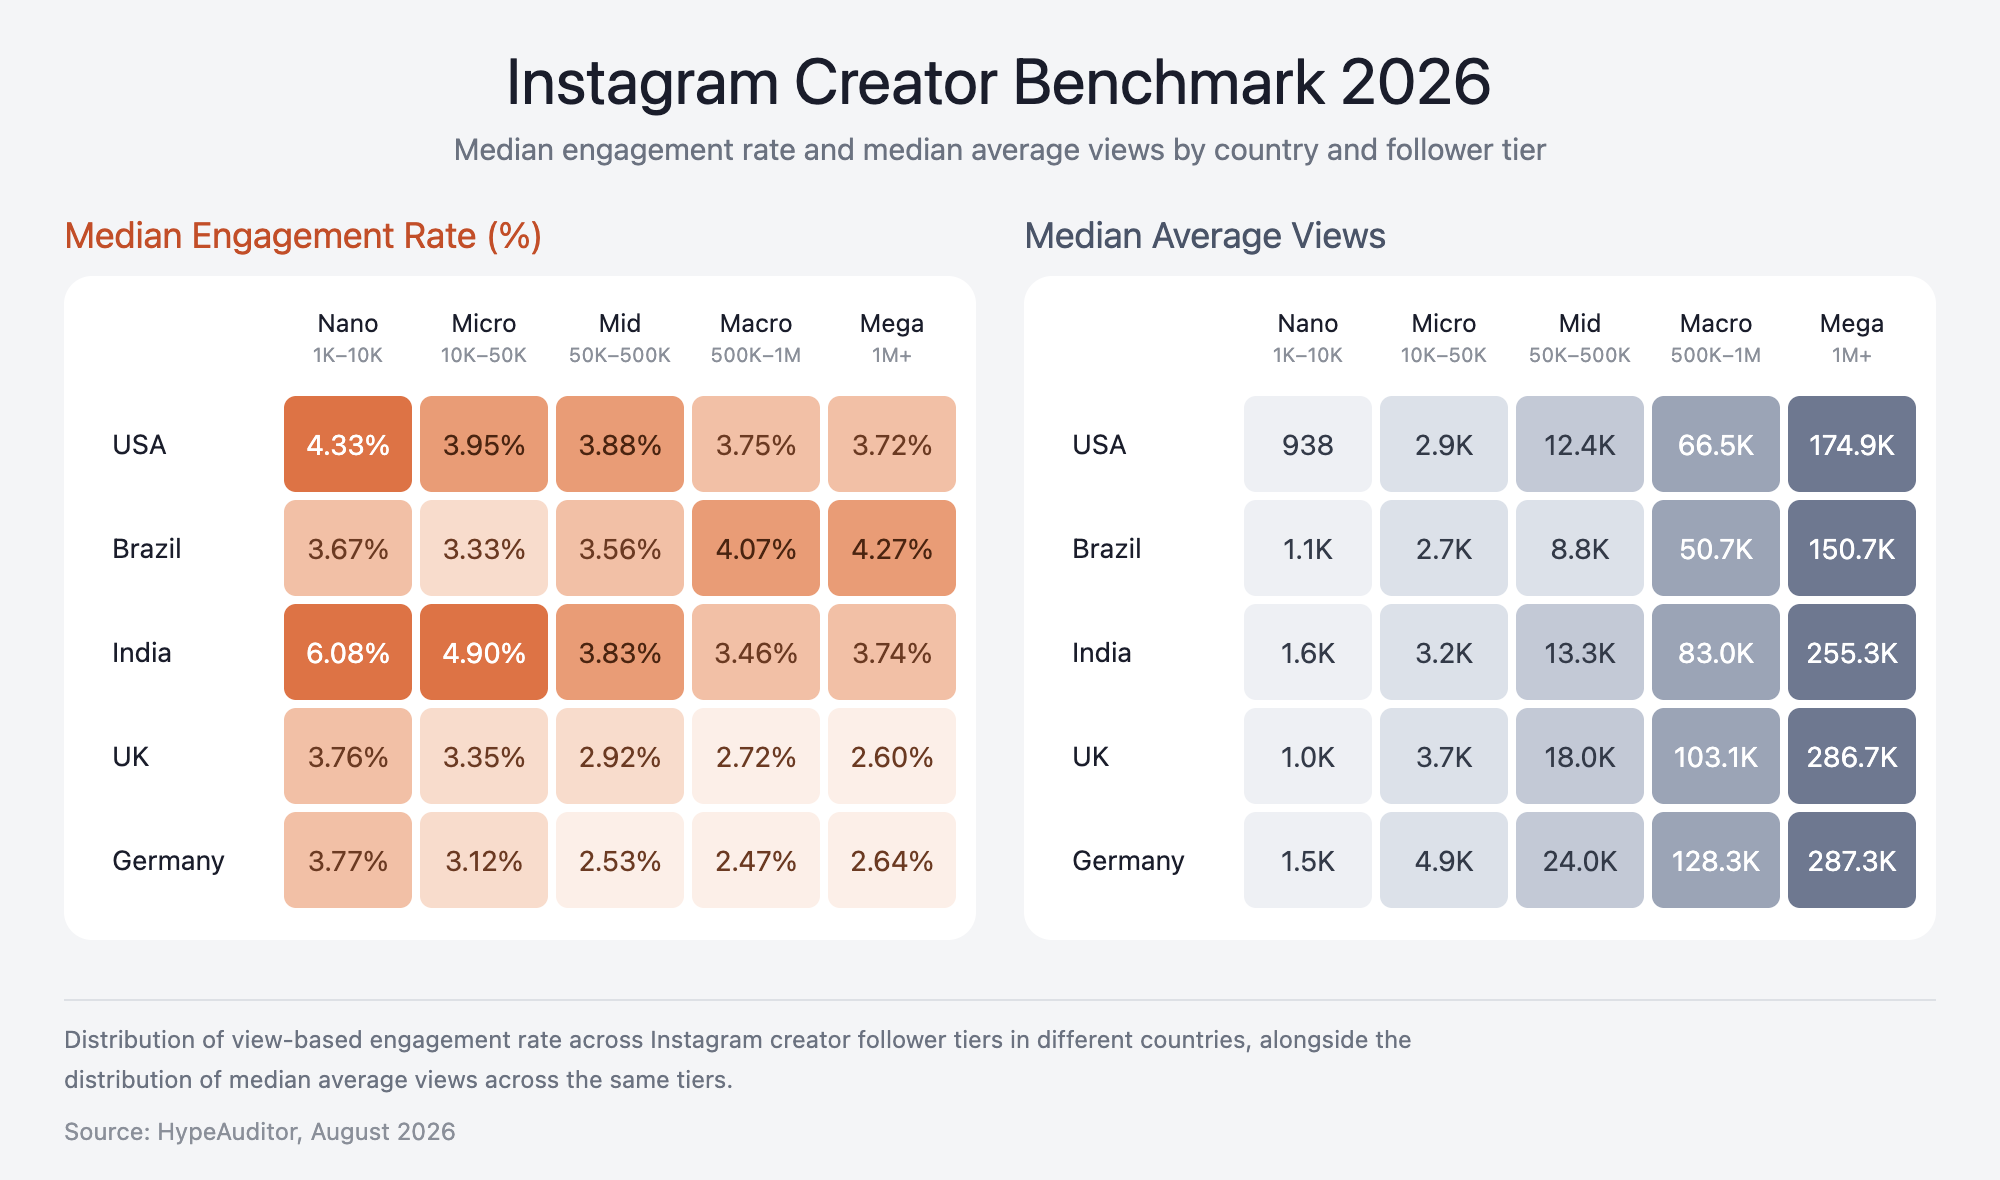
For example, among US creators with 50K–500K followers, our benchmark shows a 3.88% median Engagement Rate, with median Average Views of 12.4K.
These are medians, not targets or minimum requirements. A median simply means that roughly half of comparable creators are above that level and half are below it.
Now imagine you are considering a US creator with 150K followers who averages 30K views and has a view-based ER of 5%.
Both metrics are above the median for comparable creators.
That doesn't automatically mean you should sign them, but it's a useful indicator that their content is outperforming peers of a similar size in the same market, and a good reason to shortlist them for a closer look.
Aufrufe und ER sagen unterschiedliche Dinge aus
I would not use either metric in isolation.
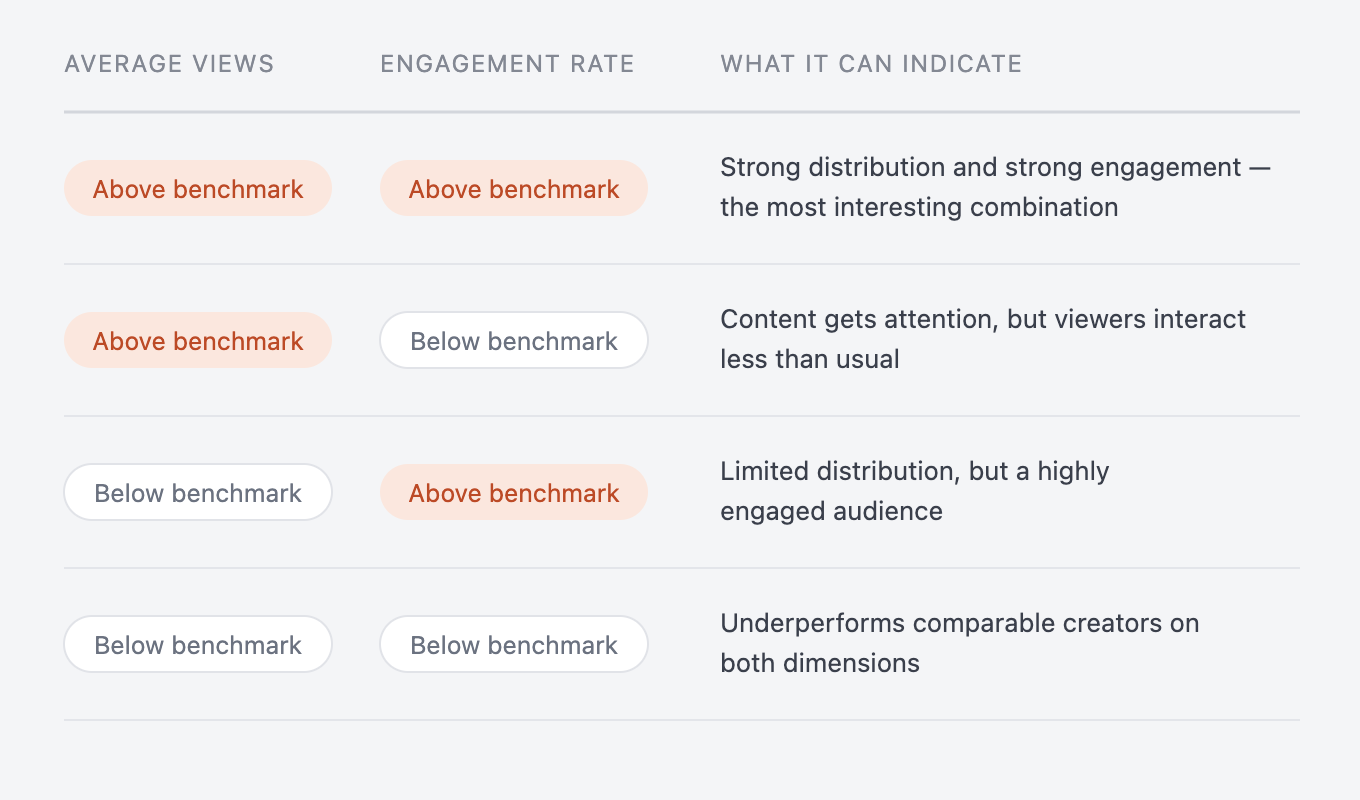
Average Views tells you about distribution power: how much attention the creator’s content typically manages to generate.
Engagement Rate tells you about engagement efficiency: how strongly people interact with the content once it reaches them.
Looking at both gives you a more useful read on where a creator stands:
There is another reason to keep both numbers in mind.
A 3% Engagement Rate on 1,000 views and a 3% Engagement Rate on 100,000 views represent very different levels of audience response.
The percentage may be identical, but the absolute scale of engagement is not.
Organische Reels-Performance nutzen, um Content für bezahlte Verstärkung auszuwählen
Brands increasingly take content that's already published organically and put paid media behind it, through Instagram Partnership Ads or similar tools. Organic performance can act as an initial creative signal here.
A Reel that significantly outperforms the typical views for comparable creators has already shown an ability to attract attention without paid distribution. I would start testing with content like this before spending the budget behind weaker performers.
I'd treat this as a creative pre-test, not a guarantee, since targeting, objective, and placement still decide paid results. Given a few assets to pick from, I'd start with whichever already showed it could attract attention on its own.
Hohes Engagement bedeutet nicht zwangsläufig positives Engagement
There is one more thing that benchmarks cannot tell us.
A high Engagement Rate tells you that people are reacting. It does not tell you why they are reacting.
A Reel may generate lots of comments because people love it. It may also generate lots of comments because it is controversial, confusing or attracting negative reactions.
So once the numbers flag an interesting creator or piece of content, the next step is qualitative: open the Reel, read the comments and understand what exactly is driving the engagement and whether that response is appropriate for your brand.
Ein Benchmark liefert Ihnen einen Vergleichswert
A 4% Engagement Rate can be strong for one creator and completely normal for another. It depends on factors such as follower size, market, and platform.
That’s why I would compare a creator’s views and ER with similar creators in the same market and follower range, rather than judging the number on its own.
Our benchmark is designed to supply that missing comparison, helping marketers identify creators and Reels that stand out from comparable content before moving on to the equally important questions of brand fit, audience quality, content quality, and campaign objectives.