



NÚMERO 4, AGOSTO 2026
HypeAuditor Digest
Análisis, tendencias y novedades

NOVEDADES DEL PRODUCTO
Qué hay de nuevo en HypeAuditor
Actualizamos la forma en que se calcula la tasa de engagement en HypeAuditor para reflejar mejor cómo las plataformas sociales distribuyen el contenido hoy en día. A medida que cambia la forma en que las personas descubren e interactúan con el contenido, las métricas que usamos también tienen que evolucionar.
Esto es lo que cambió, por qué hicimos esta actualización y qué significa para los números de ER que ves en nuestros informes.
La nueva fórmula
En todos nuestros informes de influencers, HypeAuditor ahora selecciona primero el tipo de contenido más relevante antes de calcular el ER.
Para cuentas con suficientes reels o contenido de video, usamos un cálculo basado en vistas:
ER = (Me gusta + Comentarios) / Vistas × 100 %
Cuando no hay suficiente contenido de video, usamos el cálculo basado en publicaciones:
ER = (Me gusta + Comentarios) / Seguidores × 100 %
En ambos casos, calculamos el ER para cada contenido de forma individual y usamos la mediana para ofrecer una imagen más representativa del desempeño reciente.
NOTICIAS DE MARKETING
Lo que estamos compartiendo
Cada mes es una nueva oportunidad para crear algo útil y que valga la pena compartir. Y este mes tenemos algo un poco distinto esperándote. Creemos que te va a venir muy bien.
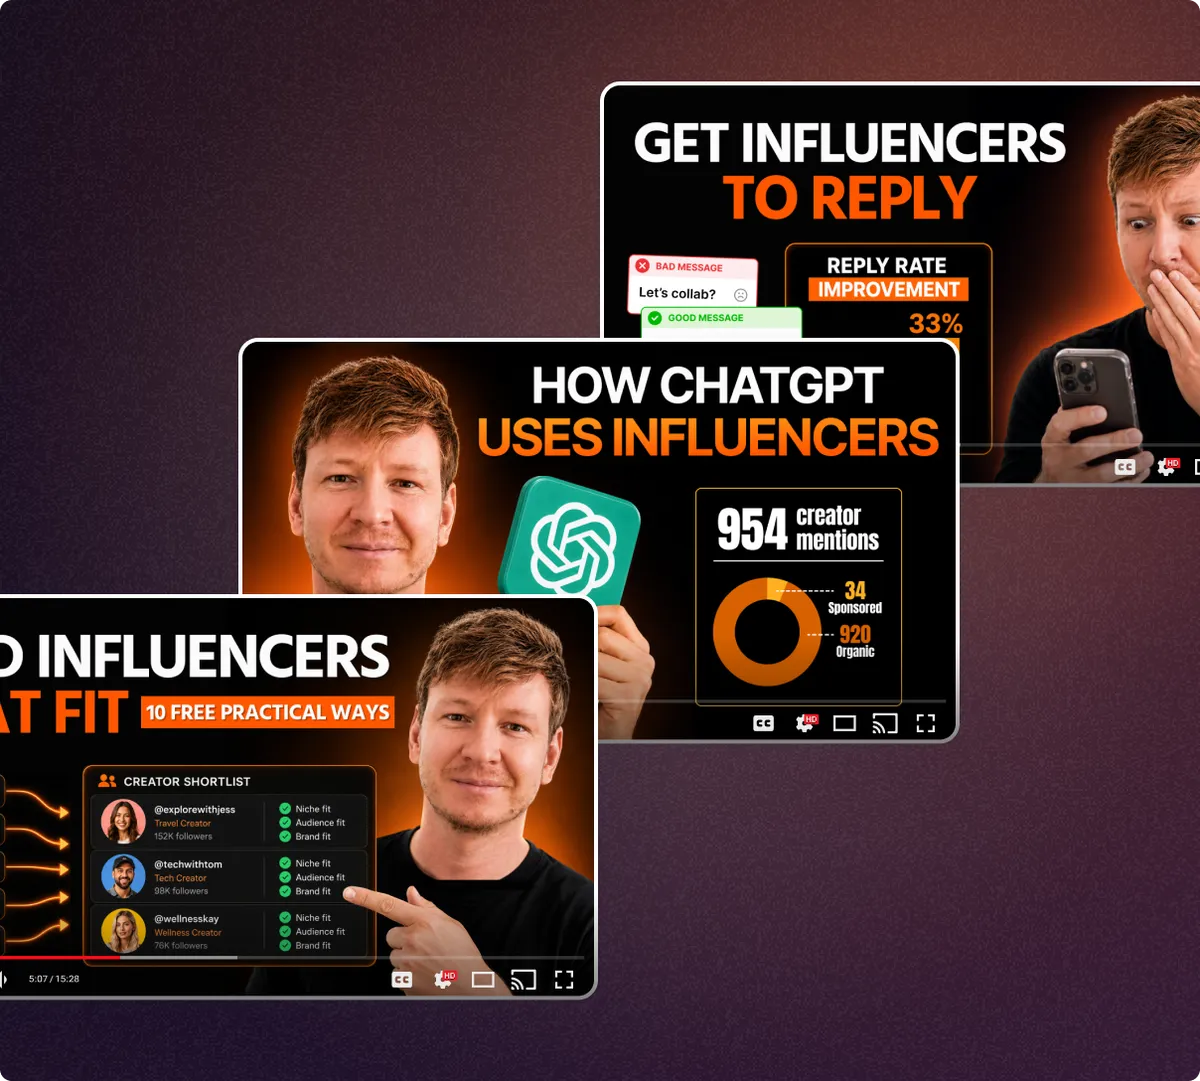
Lo nuevo del canal de YouTube del CEO
Este mes, Alex Frolov aborda un poco de todo lo que los equipos de marketing enfrentan en las campañas de influencers: encontrar a los creadores adecuados, lograr que respondan y descubrir qué se puede aprender de las jugadas de marketing de creadores de otra marca reconocida. Elige tu próximo video:
Cómo encontrar influencers rápido (10 formas prácticas que funcionan)Estrategia de outreach a influencers: cómo lograr más del 30 % de tasa de respuestaCómo OpenAI usa el marketing de creadores (análisis de su estrategia) 📊Un curso gratuito para quienes recién empiezan
Si eres nuevo en el marketing de influencers, o estás capacitando a alguien que lo es, acabamos de lanzar un curso por correo totalmente gratuito, pensado justamente para eso. Siete lecciones llegan a tu bandeja de entrada una por día, cada una lo suficientemente corta como para leerla en una pausa, narradas por un gato pirata con bastante sentido del humor, así que nunca se siente como tarea. ¿Se puede pedir algo mejor?
Inscribite en el curso gratuito
DESTACADO DEL MES
Las verdaderas razones por las que la tasa de engagement importa en el marketing de influencers
5 razones por las que el ER sigue siendo útil en el marketing de influencers

Aun así, el ER es una métrica, no todo el veredicto
No existe una tasa de engagement "buena" de forma universal, y ningún número por sí solo debería definir una preselección de creadores. Compara el ER con benchmarks relevantes y después mira las vistas, la calidad de la audiencia, qué tan bien encaja el contenido y el objetivo de tu campaña para tener una imagen más completa.
EL RINCÓN DEL ANALISTA
La forma correcta de evaluar la tasa de engagement de un creador
Un número de ER por sí solo no dice mucho, a menos que entiendas en qué se basa y cómo luce un resultado típico para creadores comparables.
Para este benchmark, me enfoco en la tasa de engagement basada en vistas
Encuentro que este enfoque es particularmente útil para los reels, porque la cantidad de seguidores por sí sola cada vez dice menos sobre cuánta distribución puede generar realmente un creador. Por eso siempre miro dos métricas juntas: la mediana de vistas promedio y la mediana de la tasa de engagement.

Cómo usar el benchmark
La forma más fácil de usar el benchmark es tomar un creador que estés considerando y compararlo con creadores de un tamaño similar en el mismo mercado. La tabla de abajo desglosa ambas métricas por país y por nivel de seguidores.
The easiest way to use the benchmark is to take a creator you are considering and compare them with creators of a similar size in the same market. The table below breaks both metrics down by country and follower tier.
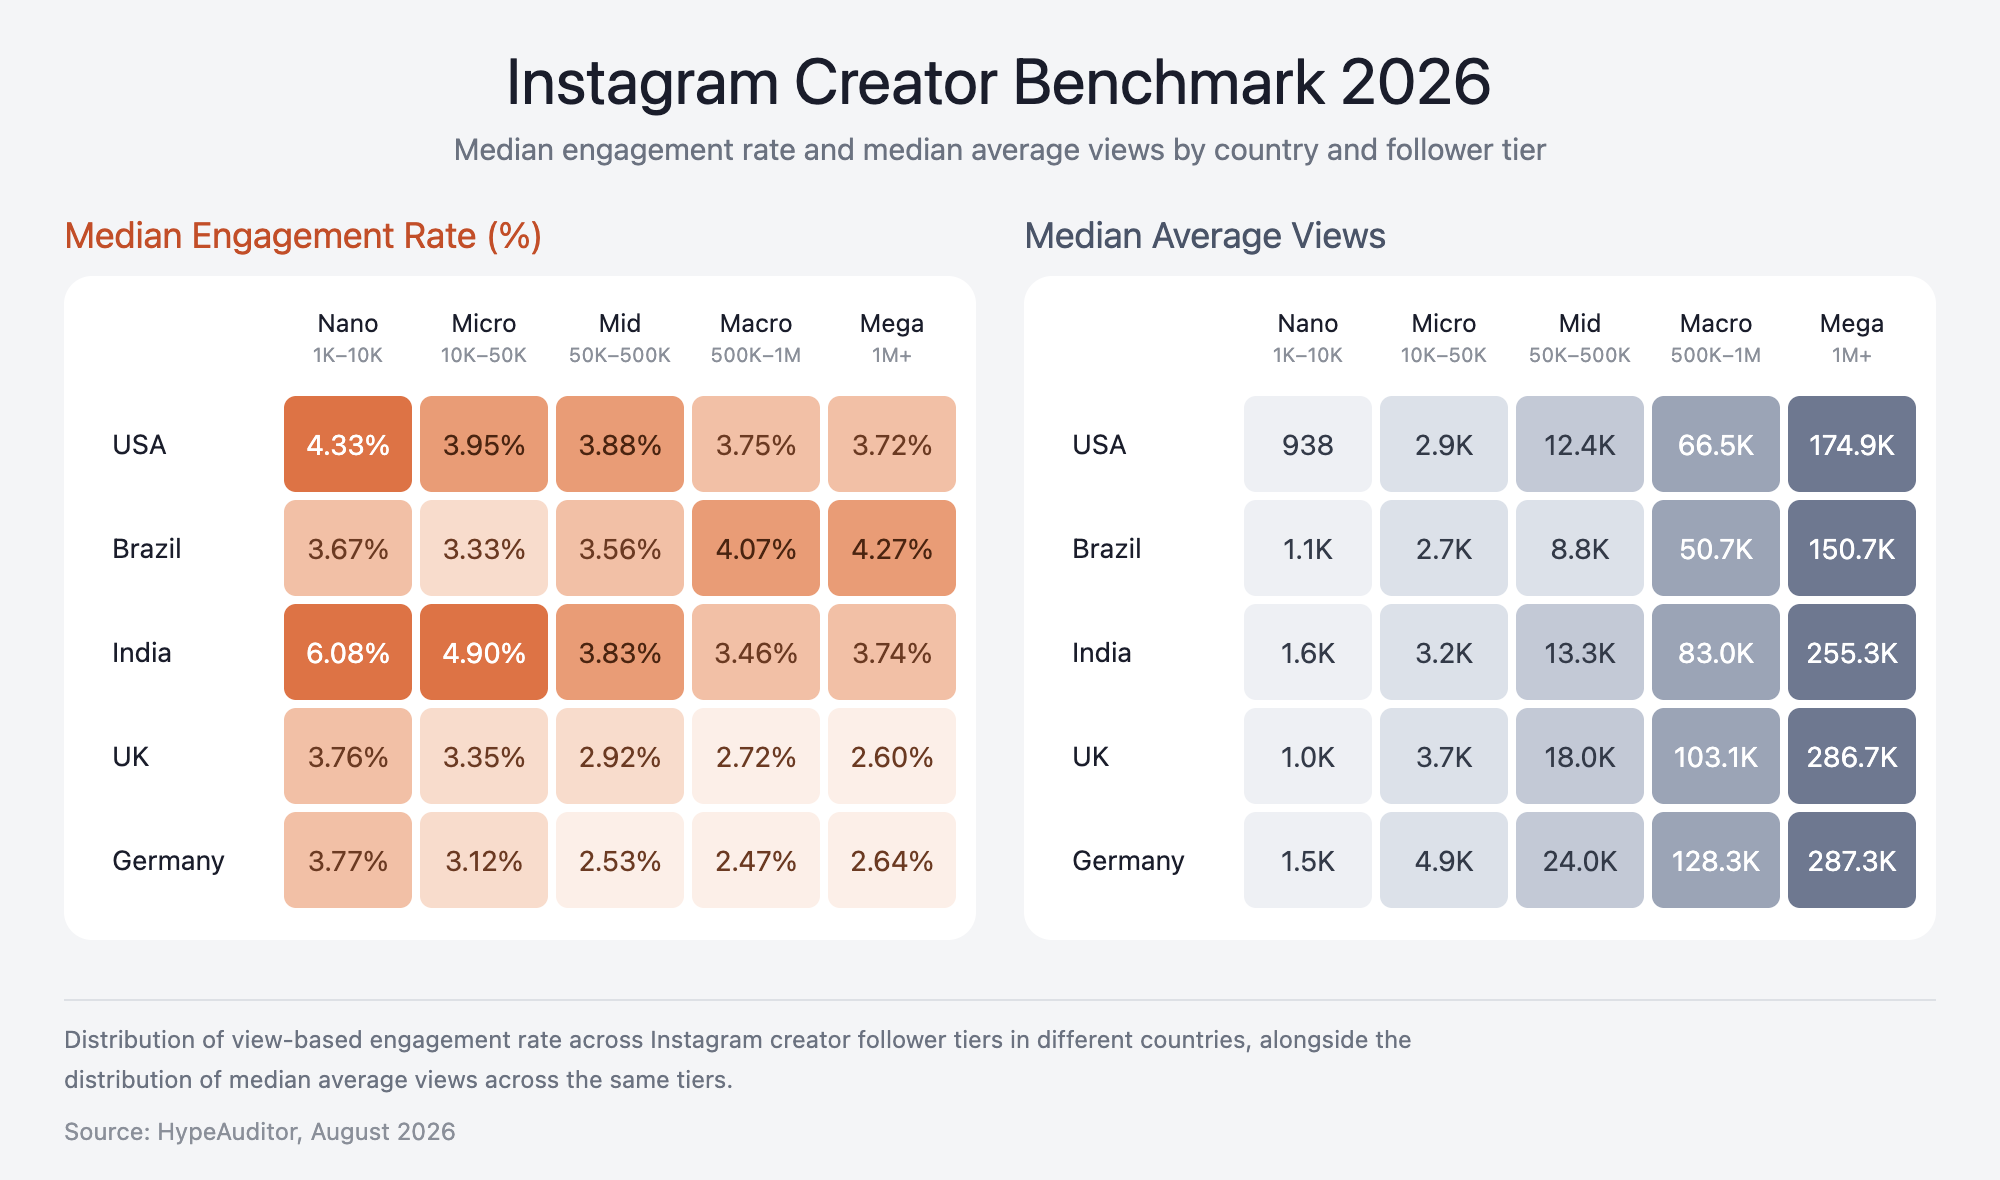
For example, among US creators with 50K–500K followers, our benchmark shows a 3.88% median Engagement Rate, with median Average Views of 12.4K.
These are medians, not targets or minimum requirements. A median simply means that roughly half of comparable creators are above that level and half are below it.
Now imagine you are considering a US creator with 150K followers who averages 30K views and has a view-based ER of 5%.
Both metrics are above the median for comparable creators.
That doesn't automatically mean you should sign them, but it's a useful indicator that their content is outperforming peers of a similar size in the same market, and a good reason to shortlist them for a closer look.
Las vistas y el ER dicen cosas distintas
I would not use either metric in isolation.
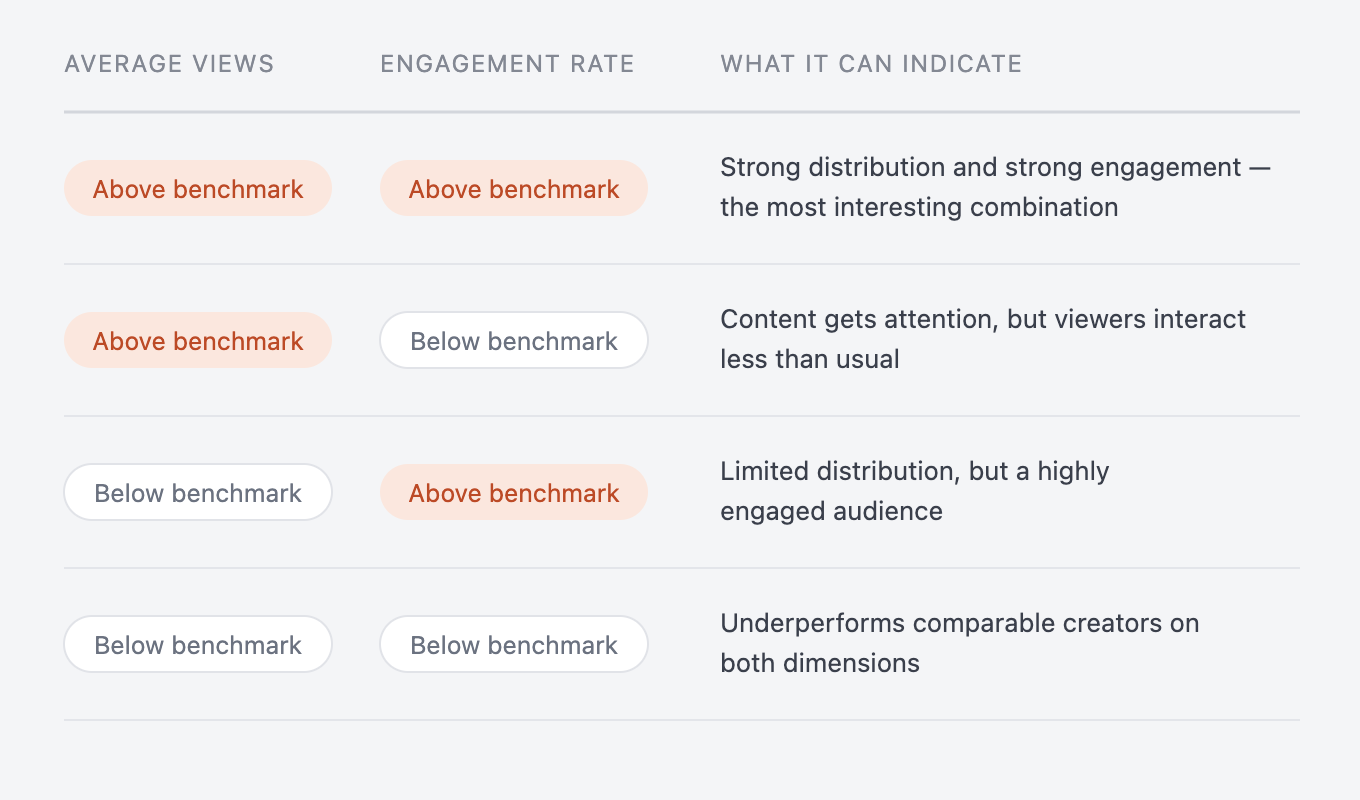
Average Views tells you about distribution power: how much attention the creator’s content typically manages to generate.
Engagement Rate tells you about engagement efficiency: how strongly people interact with the content once it reaches them.
Looking at both gives you a more useful read on where a creator stands:
There is another reason to keep both numbers in mind.
A 3% Engagement Rate on 1,000 views and a 3% Engagement Rate on 100,000 views represent very different levels of audience response.
The percentage may be identical, but the absolute scale of engagement is not.
Usar el rendimiento orgánico de los reels para elegir contenido para amplificación paga
Brands increasingly take content that's already published organically and put paid media behind it, through Instagram Partnership Ads or similar tools. Organic performance can act as an initial creative signal here.
A Reel that significantly outperforms the typical views for comparable creators has already shown an ability to attract attention without paid distribution. I would start testing with content like this before spending the budget behind weaker performers.
I'd treat this as a creative pre-test, not a guarantee, since targeting, objective, and placement still decide paid results. Given a few assets to pick from, I'd start with whichever already showed it could attract attention on its own.
Un engagement alto no siempre significa un engagement positivo
There is one more thing that benchmarks cannot tell us.
A high Engagement Rate tells you that people are reacting. It does not tell you why they are reacting.
A Reel may generate lots of comments because people love it. It may also generate lots of comments because it is controversial, confusing or attracting negative reactions.
So once the numbers flag an interesting creator or piece of content, the next step is qualitative: open the Reel, read the comments and understand what exactly is driving the engagement and whether that response is appropriate for your brand.
Un benchmark te da algo con qué comparar
A 4% Engagement Rate can be strong for one creator and completely normal for another. It depends on factors such as follower size, market, and platform.
That’s why I would compare a creator’s views and ER with similar creators in the same market and follower range, rather than judging the number on its own.
Our benchmark is designed to supply that missing comparison, helping marketers identify creators and Reels that stand out from comparable content before moving on to the equally important questions of brand fit, audience quality, content quality, and campaign objectives.