



EDIÇÃO 4, AGOSTO DE 2026
HypeAuditor Digest
Novidades, tendências e insights do marketing de influência

ATUALIZAÇÕES DO PRODUTO
Novidades do HypeAuditor
Atualizamos a forma como a taxa de engajamento é calculada no HypeAuditor para acompanhar como as plataformas sociais distribuem conteúdo hoje em dia. Conforme muda a forma como as pessoas descobrem e interagem com o conteúdo, as métricas que usamos também precisam evoluir.
Veja o que mudou, por que fizemos essa atualização e o que isso significa para os números de ER que você vê nos nossos relatórios.
A nova fórmula
Em todos os nossos relatórios de influenciadores, o HypeAuditor agora seleciona o tipo de conteúdo mais relevante antes de calcular o ER.
Para contas com Reels ou conteúdo em vídeo suficiente, usamos um cálculo baseado em visualizações:
ER = (Curtidas + Comentários) / Visualizações × 100%
Quando não há conteúdo em vídeo suficiente, usamos o cálculo baseado em publicações:
ER = (Curtidas + Comentários) / Seguidores × 100%
Em ambos os casos, calculamos o ER para cada conteúdo individualmente e usamos a mediana para obter um retrato mais representativo do desempenho recente.
NOTÍCIAS DE MARKETING
Conteúdos que estamos compartilhando
Todo mês é uma nova oportunidade de criar algo útil e que vale a pena compartilhar. E este mês temos algo um pouco diferente esperando por você. Achamos que vai ser bem útil.
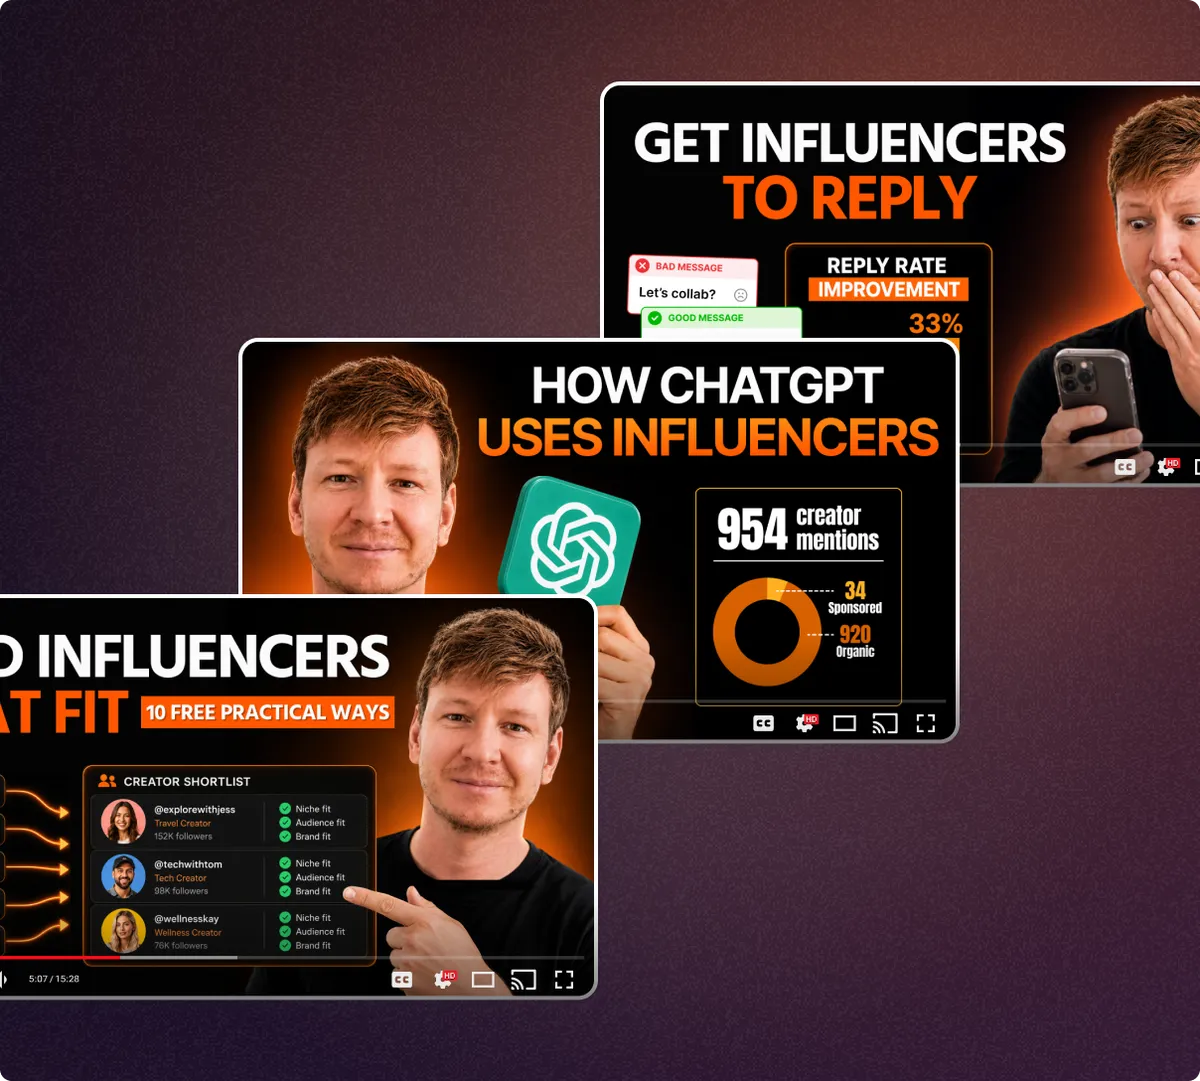
Novidades do canal do YouTube do CEO
Este mês, Alex Frolov aborda praticamente tudo o que os profissionais de marketing enfrentam em campanhas de influência: encontrar os criadores certos, conseguir que respondam e entender o que dá para aprender com as jogadas inteligentes de creator marketing de outra marca conhecida. Escolha um deles:
Como encontrar influenciadores rápido (10 formas práticas que funcionam)Estratégia de outreach para influenciadores: como conseguir mais de 30% de taxa de respostaComo a OpenAI usa creator marketing (análise da estratégia) 📊Um curso gratuito para quem está começando
Se você é novo no marketing de influência, ou está treinando alguém que é, acabamos de lançar um curso por e-mail totalmente gratuito, feito exatamente para isso. Sete lições chegam na sua caixa de entrada, uma por dia, cada uma curta o suficiente para você ler durante uma pausa, e todas narradas por um gato pirata com bastante senso de humor, para que nunca pareça dever de casa. Dá pra pedir mais?
Inscreva-se no curso gratuito
DESTAQUE DO MÊS
Os verdadeiros motivos pelos quais a taxa de engajamento importa no marketing de influência
5 motivos pelos quais o ER continua útil no marketing de influência

Ainda assim, o ER é uma métrica, não o veredito completo
Não existe uma taxa de engajamento "boa" de forma universal, e nenhum número isolado deveria decidir uma shortlist de criadores. Compare o ER com benchmarks relevantes e depois olhe para visualizações, qualidade da audiência, aderência do conteúdo e o objetivo da sua campanha para ter um retrato mais completo.
CANTINHO DO ANALISTA
A forma correta de avaliar a taxa de engajamento de um criador
Um número de ER sozinho não diz muita coisa, a menos que você entenda em que ele se baseia e como é um resultado típico para criadores comparáveis.
Para este benchmark, eu foco na taxa de engajamento baseada em visualizações
Considero essa abordagem especialmente útil para Reels, porque o número de seguidores por si só está dizendo cada vez menos sobre quanta distribuição um criador realmente consegue gerar. É por isso que eu sempre olho duas métricas juntas: a mediana de visualizações médias e a mediana da taxa de engajamento.

Como usar o benchmark
A forma mais fácil de usar o benchmark é pegar um criador que você está considerando e compará-lo com criadores de tamanho parecido no mesmo mercado. A tabela abaixo detalha as duas métricas por país e faixa de seguidores.
The easiest way to use the benchmark is to take a creator you are considering and compare them with creators of a similar size in the same market. The table below breaks both metrics down by country and follower tier.
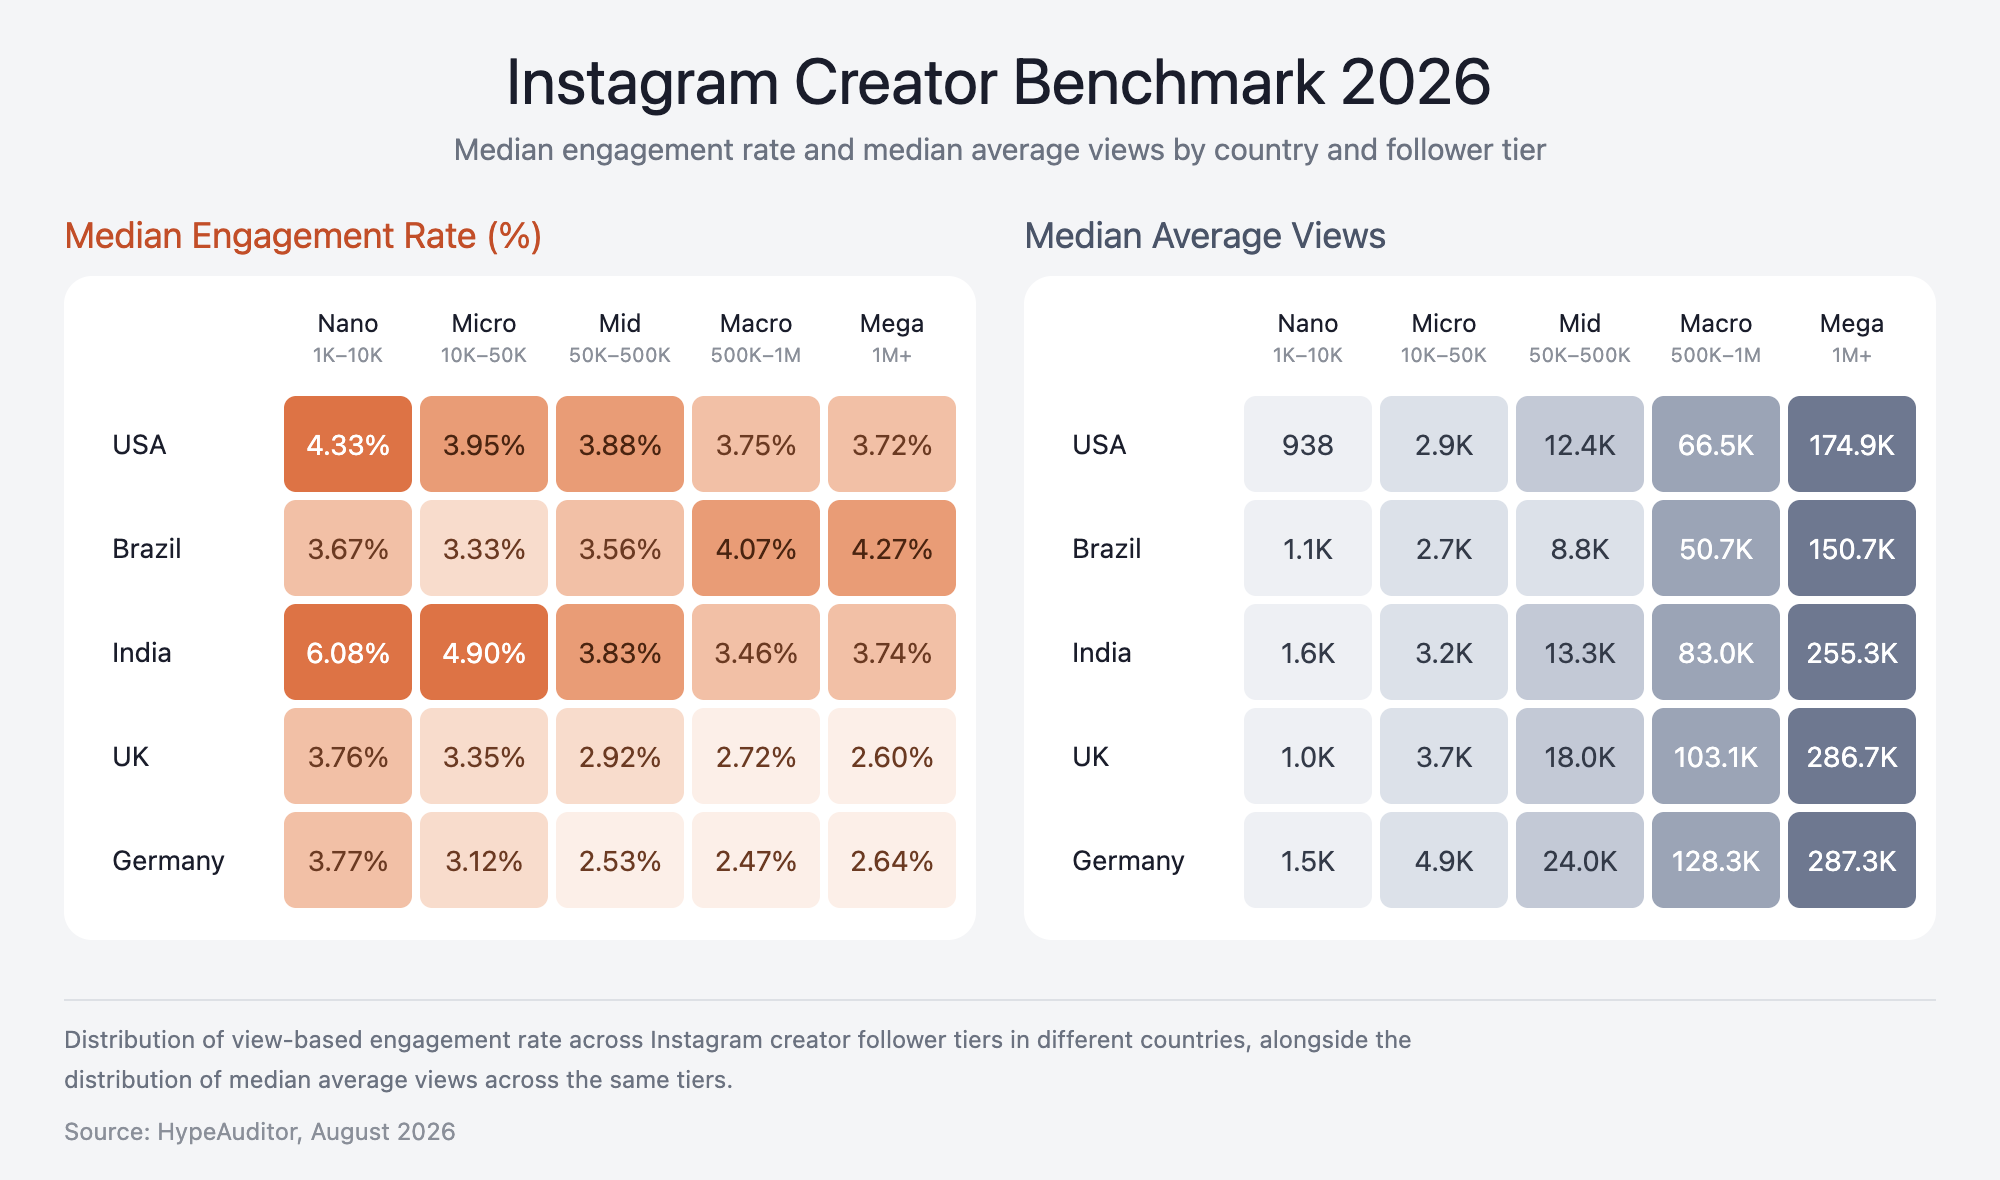
For example, among US creators with 50K–500K followers, our benchmark shows a 3.88% median Engagement Rate, with median Average Views of 12.4K.
These are medians, not targets or minimum requirements. A median simply means that roughly half of comparable creators are above that level and half are below it.
Now imagine you are considering a US creator with 150K followers who averages 30K views and has a view-based ER of 5%.
Both metrics are above the median for comparable creators.
That doesn't automatically mean you should sign them, but it's a useful indicator that their content is outperforming peers of a similar size in the same market, and a good reason to shortlist them for a closer look.
Visualizações e ER dizem coisas diferentes
I would not use either metric in isolation.
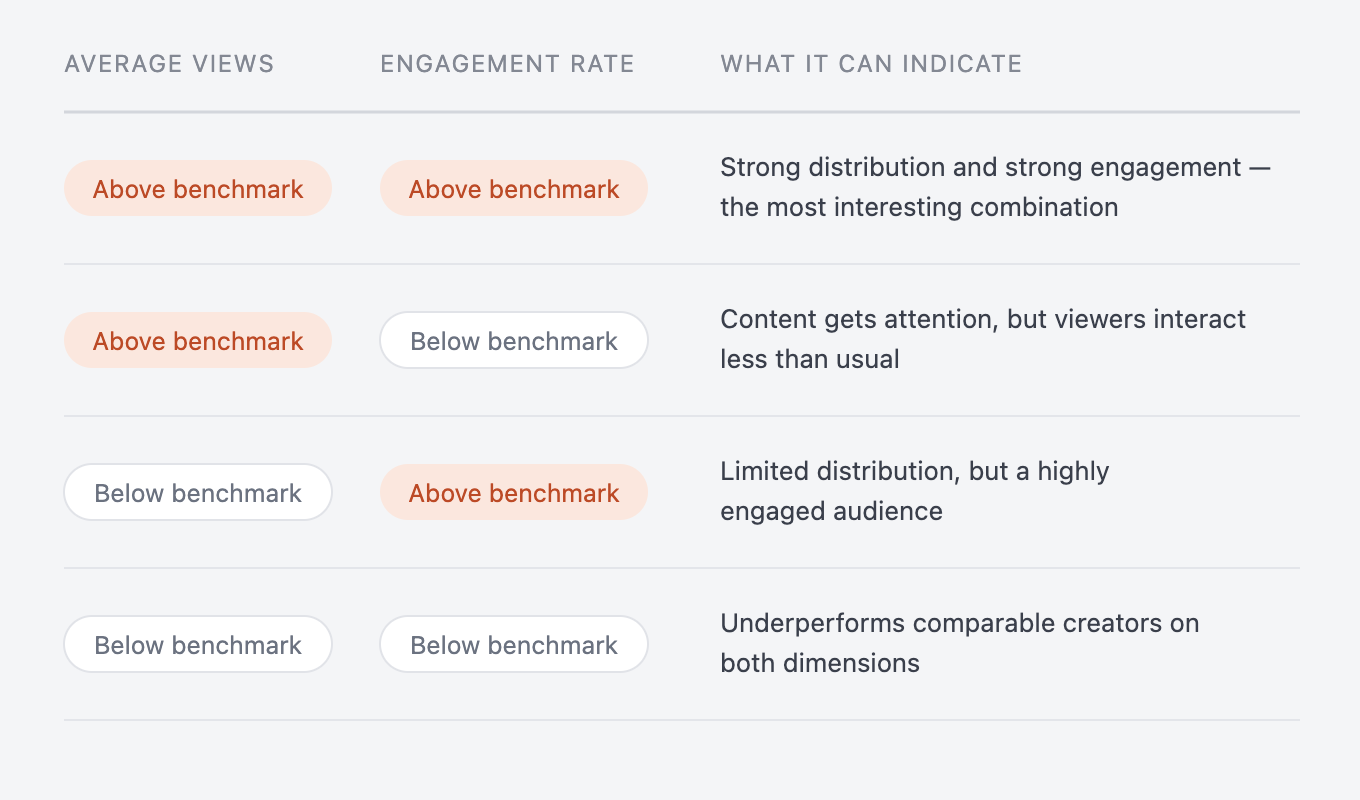
Average Views tells you about distribution power: how much attention the creator’s content typically manages to generate.
Engagement Rate tells you about engagement efficiency: how strongly people interact with the content once it reaches them.
Looking at both gives you a more useful read on where a creator stands:
There is another reason to keep both numbers in mind.
A 3% Engagement Rate on 1,000 views and a 3% Engagement Rate on 100,000 views represent very different levels of audience response.
The percentage may be identical, but the absolute scale of engagement is not.
Usar o desempenho orgânico de Reels para escolher conteúdo para amplificação paga
Brands increasingly take content that's already published organically and put paid media behind it, through Instagram Partnership Ads or similar tools. Organic performance can act as an initial creative signal here.
A Reel that significantly outperforms the typical views for comparable creators has already shown an ability to attract attention without paid distribution. I would start testing with content like this before spending the budget behind weaker performers.
I'd treat this as a creative pre-test, not a guarantee, since targeting, objective, and placement still decide paid results. Given a few assets to pick from, I'd start with whichever already showed it could attract attention on its own.
Alto engajamento não significa necessariamente engajamento positivo
There is one more thing that benchmarks cannot tell us.
A high Engagement Rate tells you that people are reacting. It does not tell you why they are reacting.
A Reel may generate lots of comments because people love it. It may also generate lots of comments because it is controversial, confusing or attracting negative reactions.
So once the numbers flag an interesting creator or piece of content, the next step is qualitative: open the Reel, read the comments and understand what exactly is driving the engagement and whether that response is appropriate for your brand.
Um benchmark te dá algo para comparar
A 4% Engagement Rate can be strong for one creator and completely normal for another. It depends on factors such as follower size, market, and platform.
That’s why I would compare a creator’s views and ER with similar creators in the same market and follower range, rather than judging the number on its own.
Our benchmark is designed to supply that missing comparison, helping marketers identify creators and Reels that stand out from comparable content before moving on to the equally important questions of brand fit, audience quality, content quality, and campaign objectives.